Lithuanian vs Yup'ik Single Female Poverty
COMPARE
Lithuanian
Yup'ik
Single Female Poverty
Single Female Poverty Comparison
Lithuanians
Yup'ik
19.2%
SINGLE FEMALE POVERTY
99.6/ 100
METRIC RATING
62nd/ 347
METRIC RANK
26.6%
SINGLE FEMALE POVERTY
0.0/ 100
METRIC RATING
321st/ 347
METRIC RANK
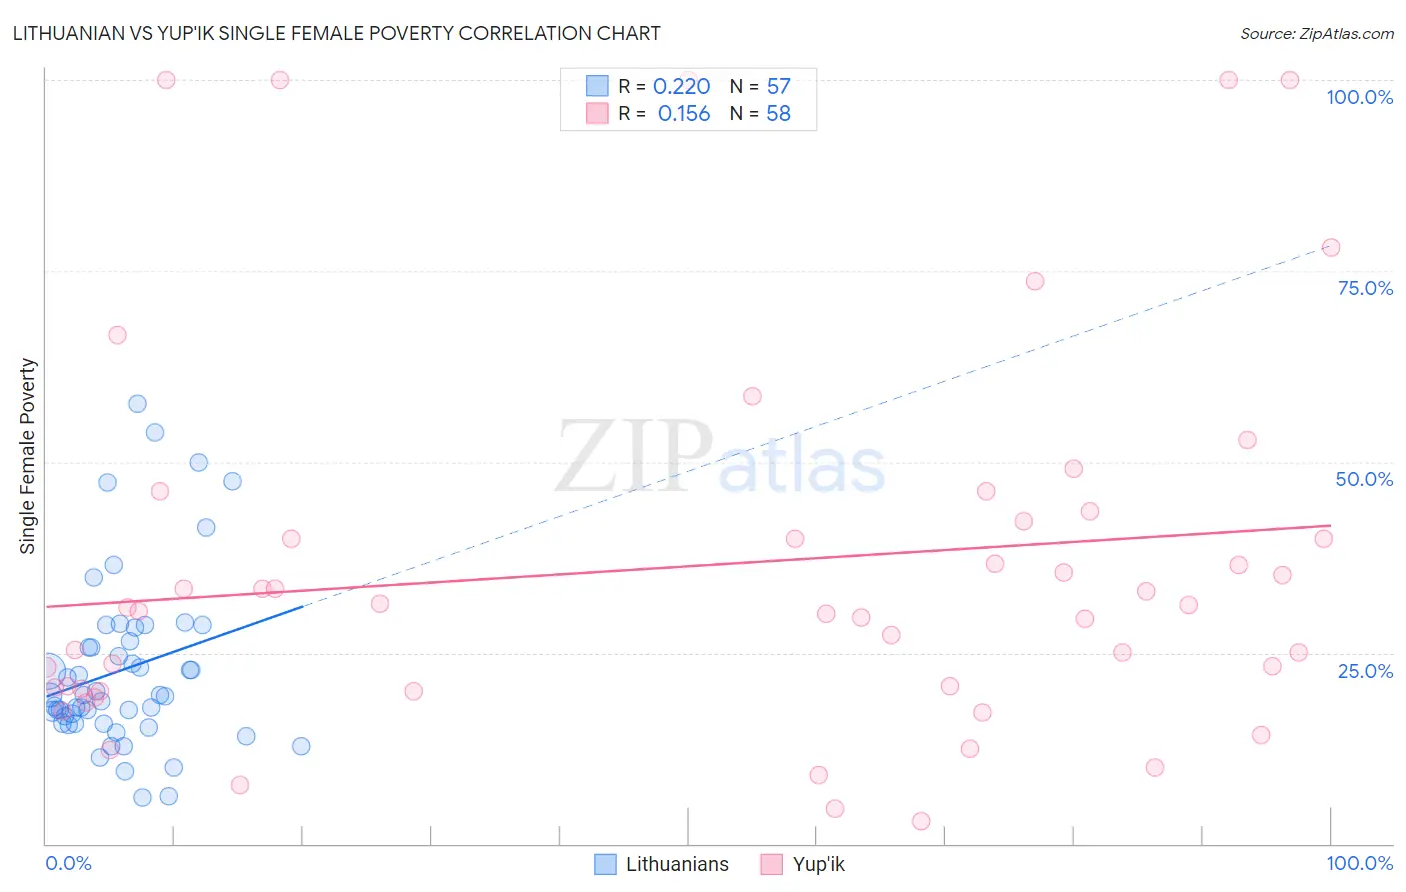
Lithuanian vs Yup'ik Single Female Poverty Correlation Chart
The statistical analysis conducted on geographies consisting of 412,150,693 people shows a weak positive correlation between the proportion of Lithuanians and poverty level among single females in the United States with a correlation coefficient (R) of 0.220 and weighted average of 19.2%. Similarly, the statistical analysis conducted on geographies consisting of 39,804,505 people shows a poor positive correlation between the proportion of Yup'ik and poverty level among single females in the United States with a correlation coefficient (R) of 0.156 and weighted average of 26.6%, a difference of 38.5%.
Single Female Poverty Correlation Summary
| Measurement | Lithuanian | Yup'ik |
| Minimum | 6.1% | 2.9% |
| Maximum | 57.6% | 100.0% |
| Range | 51.5% | 97.1% |
| Mean | 22.8% | 36.3% |
| Median | 19.4% | 30.7% |
| Interquartile 25% (IQ1) | 15.7% | 20.3% |
| Interquartile 75% (IQ3) | 27.4% | 42.3% |
| Interquartile Range (IQR) | 11.7% | 22.0% |
| Standard Deviation (Sample) | 11.3% | 25.0% |
| Standard Deviation (Population) | 11.2% | 24.8% |
Similar Demographics by Single Female Poverty
Demographics Similar to Lithuanians by Single Female Poverty
In terms of single female poverty, the demographic groups most similar to Lithuanians are Cambodian (19.2%, a difference of 0.050%), Russian (19.2%, a difference of 0.070%), Immigrants from Northern Europe (19.2%, a difference of 0.12%), Immigrants from Europe (19.2%, a difference of 0.13%), and Cypriot (19.2%, a difference of 0.15%).
| Demographics | Rating | Rank | Single Female Poverty |
| Immigrants | Vietnam | 99.7 /100 | #55 | Exceptional 19.1% |
| Immigrants | Fiji | 99.7 /100 | #56 | Exceptional 19.1% |
| Eastern Europeans | 99.7 /100 | #57 | Exceptional 19.1% |
| Immigrants | Bulgaria | 99.7 /100 | #58 | Exceptional 19.1% |
| Sri Lankans | 99.6 /100 | #59 | Exceptional 19.2% |
| Russians | 99.6 /100 | #60 | Exceptional 19.2% |
| Cambodians | 99.6 /100 | #61 | Exceptional 19.2% |
| Lithuanians | 99.6 /100 | #62 | Exceptional 19.2% |
| Immigrants | Northern Europe | 99.6 /100 | #63 | Exceptional 19.2% |
| Immigrants | Europe | 99.6 /100 | #64 | Exceptional 19.2% |
| Cypriots | 99.6 /100 | #65 | Exceptional 19.2% |
| Palestinians | 99.6 /100 | #66 | Exceptional 19.2% |
| Immigrants | Egypt | 99.6 /100 | #67 | Exceptional 19.2% |
| Laotians | 99.5 /100 | #68 | Exceptional 19.3% |
| Paraguayans | 99.5 /100 | #69 | Exceptional 19.3% |
Demographics Similar to Yup'ik by Single Female Poverty
In terms of single female poverty, the demographic groups most similar to Yup'ik are Arapaho (26.4%, a difference of 0.64%), Seminole (26.8%, a difference of 0.74%), Chippewa (26.8%, a difference of 0.84%), Black/African American (26.4%, a difference of 0.95%), and Kiowa (26.9%, a difference of 1.3%).
| Demographics | Rating | Rank | Single Female Poverty |
| Cherokee | 0.0 /100 | #314 | Tragic 25.7% |
| Iroquois | 0.0 /100 | #315 | Tragic 25.7% |
| Immigrants | Somalia | 0.0 /100 | #316 | Tragic 25.8% |
| Ottawa | 0.0 /100 | #317 | Tragic 26.0% |
| Chickasaw | 0.0 /100 | #318 | Tragic 26.3% |
| Blacks/African Americans | 0.0 /100 | #319 | Tragic 26.4% |
| Arapaho | 0.0 /100 | #320 | Tragic 26.4% |
| Yup'ik | 0.0 /100 | #321 | Tragic 26.6% |
| Seminole | 0.0 /100 | #322 | Tragic 26.8% |
| Chippewa | 0.0 /100 | #323 | Tragic 26.8% |
| Kiowa | 0.0 /100 | #324 | Tragic 26.9% |
| Choctaw | 0.0 /100 | #325 | Tragic 27.2% |
| Creek | 0.0 /100 | #326 | Tragic 27.4% |
| Dutch West Indians | 0.0 /100 | #327 | Tragic 27.5% |
| Apache | 0.0 /100 | #328 | Tragic 27.7% |