Lithuanian vs Yup'ik Disability
COMPARE
Lithuanian
Yup'ik
Disability
Disability Comparison
Lithuanians
Yup'ik
11.9%
DISABILITY
18.8/ 100
METRIC RATING
192nd/ 347
METRIC RANK
12.2%
DISABILITY
2.2/ 100
METRIC RATING
235th/ 347
METRIC RANK
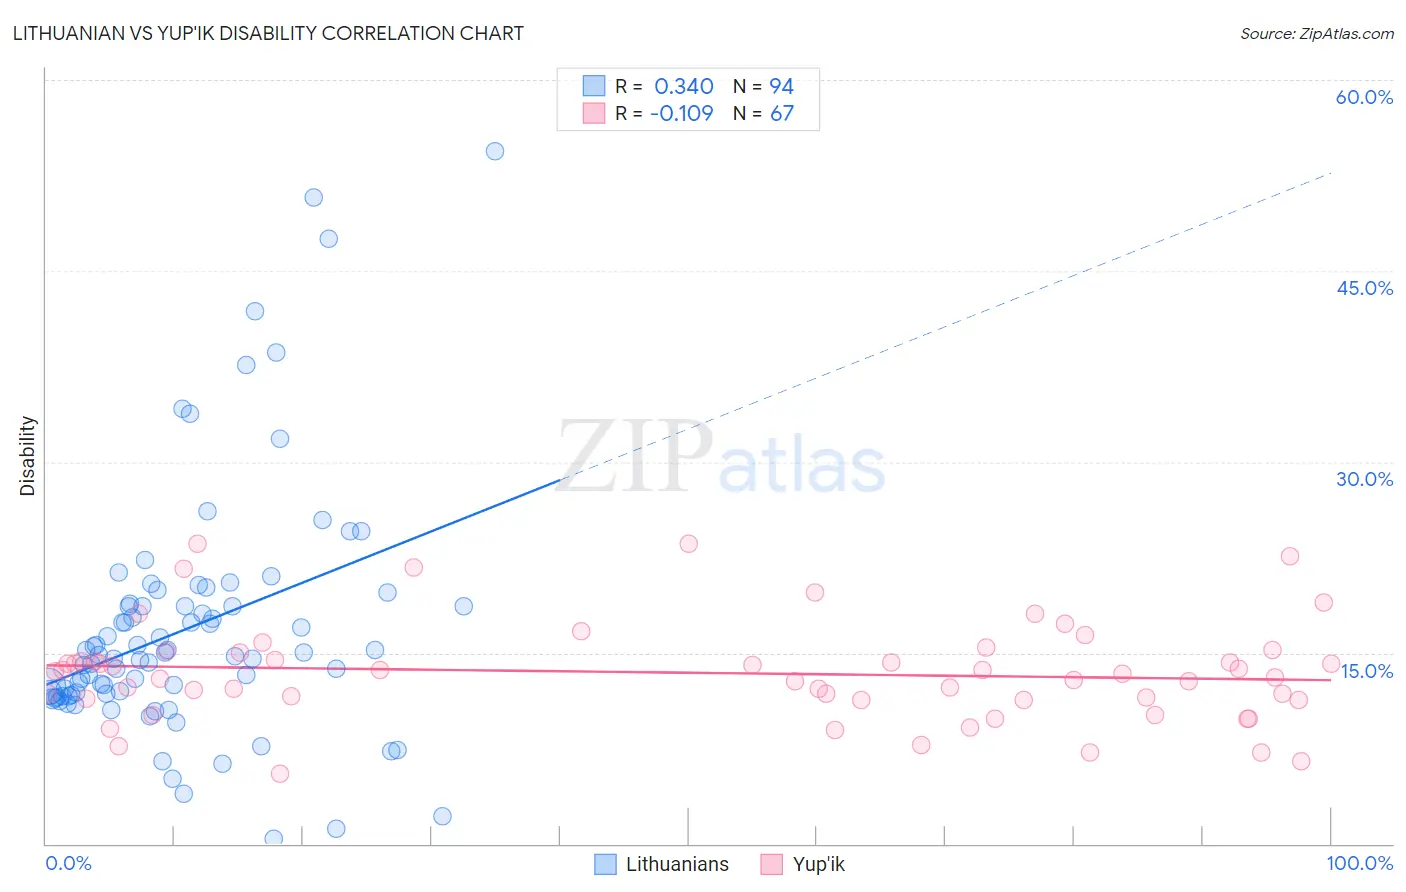
Lithuanian vs Yup'ik Disability Correlation Chart
The statistical analysis conducted on geographies consisting of 421,948,731 people shows a mild positive correlation between the proportion of Lithuanians and percentage of population with a disability in the United States with a correlation coefficient (R) of 0.340 and weighted average of 11.9%. Similarly, the statistical analysis conducted on geographies consisting of 39,961,482 people shows a poor negative correlation between the proportion of Yup'ik and percentage of population with a disability in the United States with a correlation coefficient (R) of -0.109 and weighted average of 12.2%, a difference of 2.5%.
Disability Correlation Summary
| Measurement | Lithuanian | Yup'ik |
| Minimum | 0.40% | 5.5% |
| Maximum | 54.4% | 23.6% |
| Range | 54.0% | 18.1% |
| Mean | 16.8% | 13.4% |
| Median | 14.8% | 13.3% |
| Interquartile 25% (IQ1) | 11.7% | 11.3% |
| Interquartile 75% (IQ3) | 18.7% | 15.0% |
| Interquartile Range (IQR) | 7.0% | 3.7% |
| Standard Deviation (Sample) | 9.6% | 3.9% |
| Standard Deviation (Population) | 9.6% | 3.9% |
Similar Demographics by Disability
Demographics Similar to Lithuanians by Disability
In terms of disability, the demographic groups most similar to Lithuanians are Ute (11.9%, a difference of 0.050%), Immigrants from Bosnia and Herzegovina (11.9%, a difference of 0.050%), Somali (11.9%, a difference of 0.11%), Immigrants from West Indies (11.9%, a difference of 0.16%), and Immigrants from Zaire (11.9%, a difference of 0.21%).
| Demographics | Rating | Rank | Disability |
| Immigrants | Burma/Myanmar | 28.5 /100 | #185 | Fair 11.8% |
| Immigrants | Scotland | 28.2 /100 | #186 | Fair 11.8% |
| Lebanese | 27.9 /100 | #187 | Fair 11.8% |
| Immigrants | Mexico | 23.8 /100 | #188 | Fair 11.9% |
| Immigrants | Zaire | 21.8 /100 | #189 | Fair 11.9% |
| Immigrants | West Indies | 21.1 /100 | #190 | Fair 11.9% |
| Ute | 19.5 /100 | #191 | Poor 11.9% |
| Lithuanians | 18.8 /100 | #192 | Poor 11.9% |
| Immigrants | Bosnia and Herzegovina | 18.0 /100 | #193 | Poor 11.9% |
| Somalis | 17.3 /100 | #194 | Poor 11.9% |
| Barbadians | 15.8 /100 | #195 | Poor 11.9% |
| Serbians | 15.4 /100 | #196 | Poor 11.9% |
| Immigrants | Belize | 15.2 /100 | #197 | Poor 11.9% |
| Ukrainians | 14.7 /100 | #198 | Poor 11.9% |
| Immigrants | Panama | 14.6 /100 | #199 | Poor 11.9% |
Demographics Similar to Yup'ik by Disability
In terms of disability, the demographic groups most similar to Yup'ik are Japanese (12.2%, a difference of 0.040%), Bahamian (12.2%, a difference of 0.070%), Chinese (12.2%, a difference of 0.090%), Immigrants from Congo (12.2%, a difference of 0.14%), and Italian (12.2%, a difference of 0.16%).
| Demographics | Rating | Rank | Disability |
| West Indians | 2.9 /100 | #228 | Tragic 12.2% |
| Inupiat | 2.8 /100 | #229 | Tragic 12.2% |
| Samoans | 2.6 /100 | #230 | Tragic 12.2% |
| Malaysians | 2.5 /100 | #231 | Tragic 12.2% |
| Italians | 2.5 /100 | #232 | Tragic 12.2% |
| Bahamians | 2.3 /100 | #233 | Tragic 12.2% |
| Japanese | 2.3 /100 | #234 | Tragic 12.2% |
| Yup'ik | 2.2 /100 | #235 | Tragic 12.2% |
| Chinese | 2.0 /100 | #236 | Tragic 12.2% |
| Immigrants | Congo | 1.9 /100 | #237 | Tragic 12.2% |
| Norwegians | 1.9 /100 | #238 | Tragic 12.2% |
| Swedes | 1.8 /100 | #239 | Tragic 12.2% |
| Hungarians | 1.7 /100 | #240 | Tragic 12.2% |
| Yugoslavians | 1.7 /100 | #241 | Tragic 12.2% |
| Poles | 1.7 /100 | #242 | Tragic 12.2% |