Lithuanian vs Immigrants from Zaire Single Female Poverty
COMPARE
Lithuanian
Immigrants from Zaire
Single Female Poverty
Single Female Poverty Comparison
Lithuanians
Immigrants from Zaire
19.2%
SINGLE FEMALE POVERTY
99.6/ 100
METRIC RATING
62nd/ 347
METRIC RANK
23.8%
SINGLE FEMALE POVERTY
0.0/ 100
METRIC RATING
281st/ 347
METRIC RANK
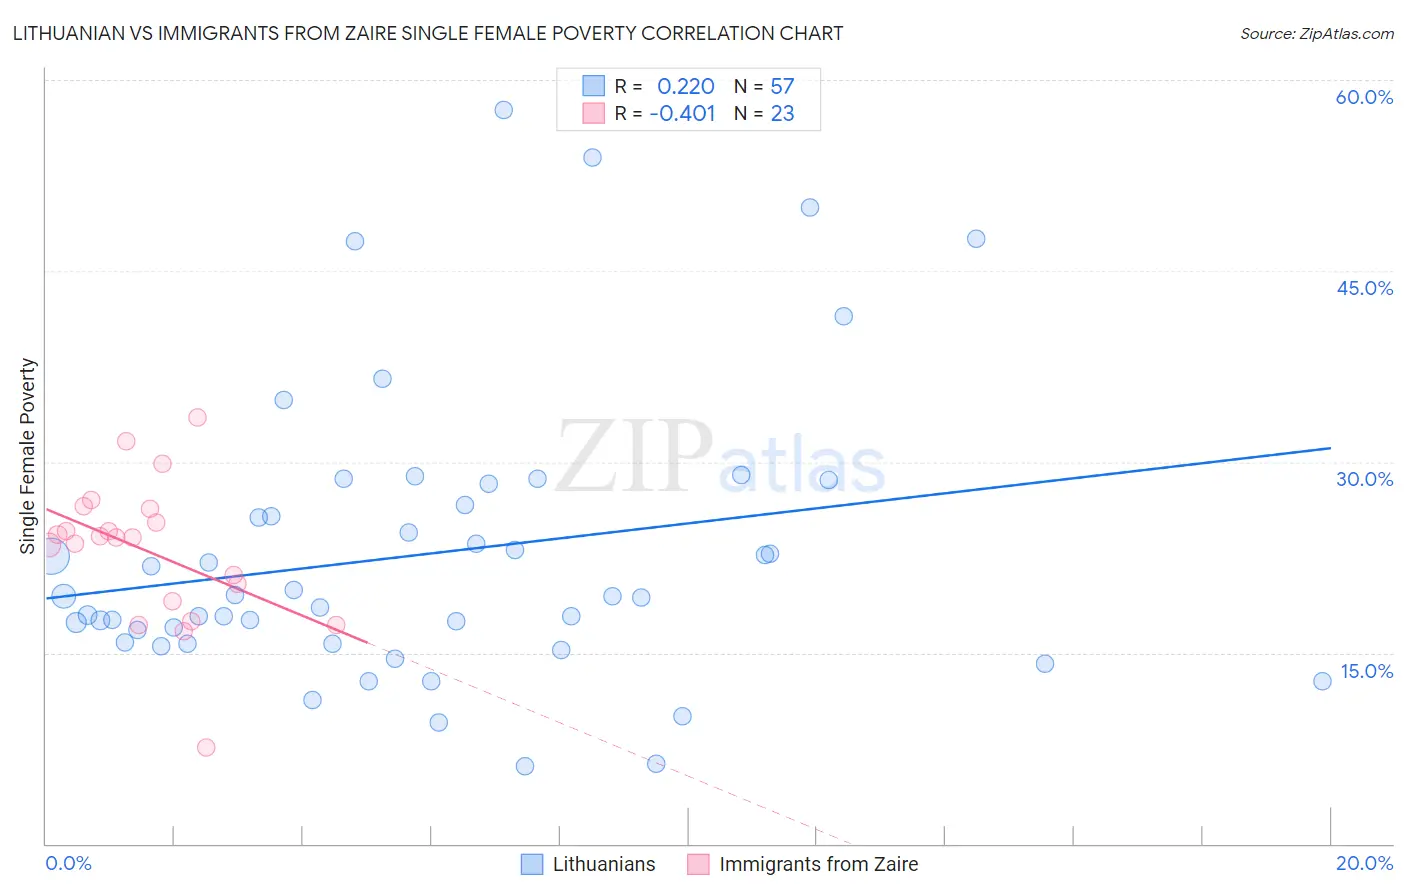
Lithuanian vs Immigrants from Zaire Single Female Poverty Correlation Chart
The statistical analysis conducted on geographies consisting of 412,150,693 people shows a weak positive correlation between the proportion of Lithuanians and poverty level among single females in the United States with a correlation coefficient (R) of 0.220 and weighted average of 19.2%. Similarly, the statistical analysis conducted on geographies consisting of 106,941,709 people shows a moderate negative correlation between the proportion of Immigrants from Zaire and poverty level among single females in the United States with a correlation coefficient (R) of -0.401 and weighted average of 23.8%, a difference of 24.1%.
Single Female Poverty Correlation Summary
| Measurement | Lithuanian | Immigrants from Zaire |
| Minimum | 6.1% | 7.5% |
| Maximum | 57.6% | 33.4% |
| Range | 51.5% | 25.9% |
| Mean | 22.8% | 23.0% |
| Median | 19.4% | 24.0% |
| Interquartile 25% (IQ1) | 15.7% | 19.0% |
| Interquartile 75% (IQ3) | 27.4% | 26.3% |
| Interquartile Range (IQR) | 11.7% | 7.3% |
| Standard Deviation (Sample) | 11.3% | 5.6% |
| Standard Deviation (Population) | 11.2% | 5.5% |
Similar Demographics by Single Female Poverty
Demographics Similar to Lithuanians by Single Female Poverty
In terms of single female poverty, the demographic groups most similar to Lithuanians are Cambodian (19.2%, a difference of 0.050%), Russian (19.2%, a difference of 0.070%), Immigrants from Northern Europe (19.2%, a difference of 0.12%), Immigrants from Europe (19.2%, a difference of 0.13%), and Cypriot (19.2%, a difference of 0.15%).
| Demographics | Rating | Rank | Single Female Poverty |
| Immigrants | Vietnam | 99.7 /100 | #55 | Exceptional 19.1% |
| Immigrants | Fiji | 99.7 /100 | #56 | Exceptional 19.1% |
| Eastern Europeans | 99.7 /100 | #57 | Exceptional 19.1% |
| Immigrants | Bulgaria | 99.7 /100 | #58 | Exceptional 19.1% |
| Sri Lankans | 99.6 /100 | #59 | Exceptional 19.2% |
| Russians | 99.6 /100 | #60 | Exceptional 19.2% |
| Cambodians | 99.6 /100 | #61 | Exceptional 19.2% |
| Lithuanians | 99.6 /100 | #62 | Exceptional 19.2% |
| Immigrants | Northern Europe | 99.6 /100 | #63 | Exceptional 19.2% |
| Immigrants | Europe | 99.6 /100 | #64 | Exceptional 19.2% |
| Cypriots | 99.6 /100 | #65 | Exceptional 19.2% |
| Palestinians | 99.6 /100 | #66 | Exceptional 19.2% |
| Immigrants | Egypt | 99.6 /100 | #67 | Exceptional 19.2% |
| Laotians | 99.5 /100 | #68 | Exceptional 19.3% |
| Paraguayans | 99.5 /100 | #69 | Exceptional 19.3% |
Demographics Similar to Immigrants from Zaire by Single Female Poverty
In terms of single female poverty, the demographic groups most similar to Immigrants from Zaire are Guatemalan (23.8%, a difference of 0.050%), German Russian (23.9%, a difference of 0.20%), Immigrants from Dominica (23.9%, a difference of 0.31%), Immigrants from Latin America (23.7%, a difference of 0.51%), and Alaskan Athabascan (23.6%, a difference of 1.0%).
| Demographics | Rating | Rank | Single Female Poverty |
| Marshallese | 0.1 /100 | #274 | Tragic 23.3% |
| Mexican American Indians | 0.1 /100 | #275 | Tragic 23.4% |
| Immigrants | Azores | 0.0 /100 | #276 | Tragic 23.5% |
| Pennsylvania Germans | 0.0 /100 | #277 | Tragic 23.6% |
| Immigrants | Nonimmigrants | 0.0 /100 | #278 | Tragic 23.6% |
| Alaskan Athabascans | 0.0 /100 | #279 | Tragic 23.6% |
| Immigrants | Latin America | 0.0 /100 | #280 | Tragic 23.7% |
| Immigrants | Zaire | 0.0 /100 | #281 | Tragic 23.8% |
| Guatemalans | 0.0 /100 | #282 | Tragic 23.8% |
| German Russians | 0.0 /100 | #283 | Tragic 23.9% |
| Immigrants | Dominica | 0.0 /100 | #284 | Tragic 23.9% |
| Immigrants | Guatemala | 0.0 /100 | #285 | Tragic 24.1% |
| Cree | 0.0 /100 | #286 | Tragic 24.1% |
| Bangladeshis | 0.0 /100 | #287 | Tragic 24.2% |
| Spanish Americans | 0.0 /100 | #288 | Tragic 24.2% |