Lithuanian vs Danish Single Female Poverty
COMPARE
Lithuanian
Danish
Single Female Poverty
Single Female Poverty Comparison
Lithuanians
Danes
19.2%
SINGLE FEMALE POVERTY
99.6/ 100
METRIC RATING
62nd/ 347
METRIC RANK
20.7%
SINGLE FEMALE POVERTY
73.0/ 100
METRIC RATING
158th/ 347
METRIC RANK
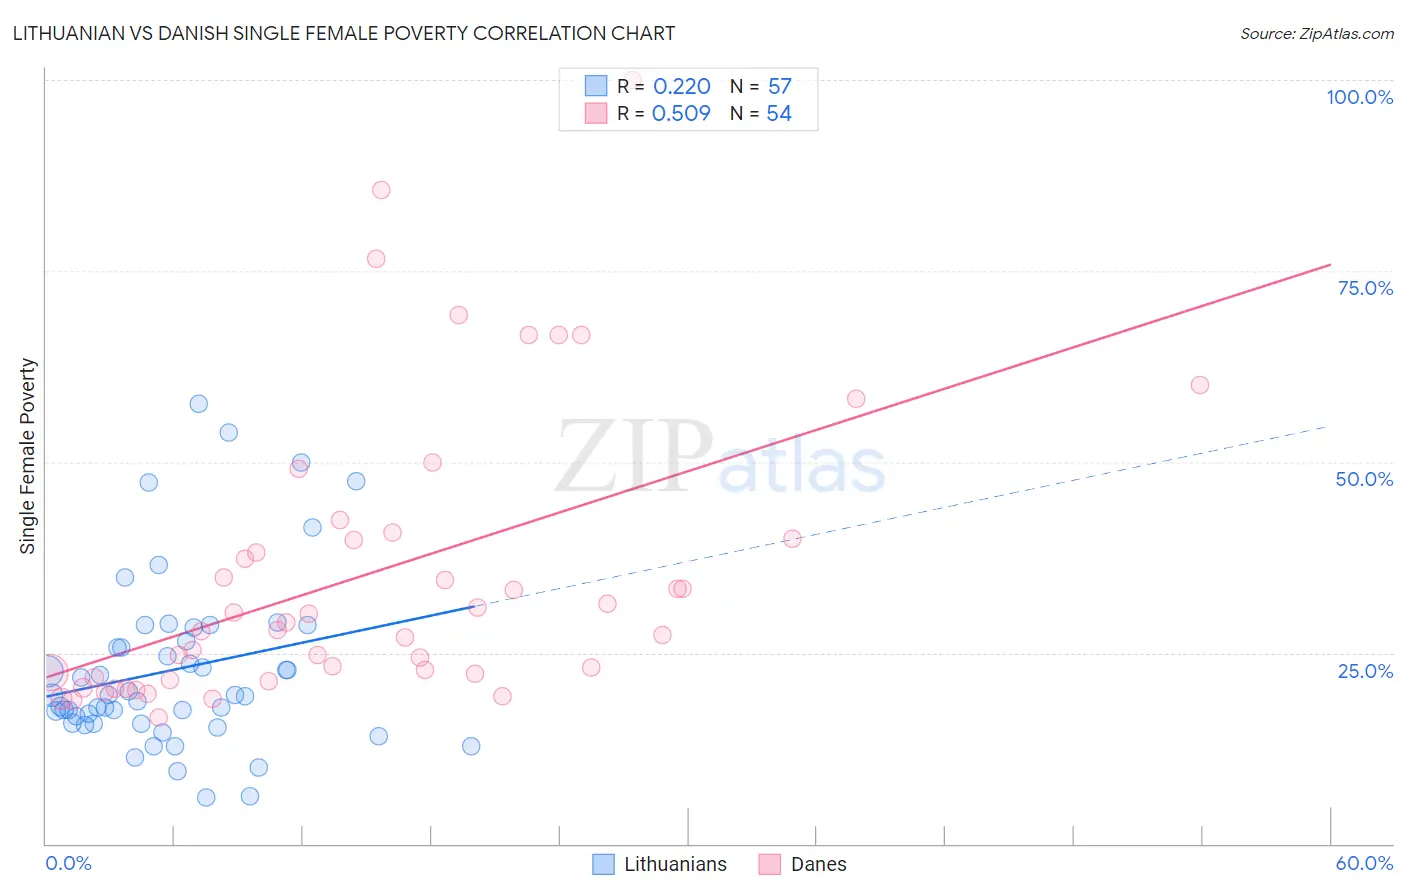
Lithuanian vs Danish Single Female Poverty Correlation Chart
The statistical analysis conducted on geographies consisting of 412,150,693 people shows a weak positive correlation between the proportion of Lithuanians and poverty level among single females in the United States with a correlation coefficient (R) of 0.220 and weighted average of 19.2%. Similarly, the statistical analysis conducted on geographies consisting of 461,634,769 people shows a substantial positive correlation between the proportion of Danes and poverty level among single females in the United States with a correlation coefficient (R) of 0.509 and weighted average of 20.7%, a difference of 7.7%.
Single Female Poverty Correlation Summary
| Measurement | Lithuanian | Danish |
| Minimum | 6.1% | 16.6% |
| Maximum | 57.6% | 100.0% |
| Range | 51.5% | 83.4% |
| Mean | 22.8% | 35.4% |
| Median | 19.4% | 28.5% |
| Interquartile 25% (IQ1) | 15.7% | 21.7% |
| Interquartile 75% (IQ3) | 27.4% | 40.0% |
| Interquartile Range (IQR) | 11.7% | 18.3% |
| Standard Deviation (Sample) | 11.3% | 19.0% |
| Standard Deviation (Population) | 11.2% | 18.8% |
Similar Demographics by Single Female Poverty
Demographics Similar to Lithuanians by Single Female Poverty
In terms of single female poverty, the demographic groups most similar to Lithuanians are Cambodian (19.2%, a difference of 0.050%), Russian (19.2%, a difference of 0.070%), Immigrants from Northern Europe (19.2%, a difference of 0.12%), Immigrants from Europe (19.2%, a difference of 0.13%), and Cypriot (19.2%, a difference of 0.15%).
| Demographics | Rating | Rank | Single Female Poverty |
| Immigrants | Vietnam | 99.7 /100 | #55 | Exceptional 19.1% |
| Immigrants | Fiji | 99.7 /100 | #56 | Exceptional 19.1% |
| Eastern Europeans | 99.7 /100 | #57 | Exceptional 19.1% |
| Immigrants | Bulgaria | 99.7 /100 | #58 | Exceptional 19.1% |
| Sri Lankans | 99.6 /100 | #59 | Exceptional 19.2% |
| Russians | 99.6 /100 | #60 | Exceptional 19.2% |
| Cambodians | 99.6 /100 | #61 | Exceptional 19.2% |
| Lithuanians | 99.6 /100 | #62 | Exceptional 19.2% |
| Immigrants | Northern Europe | 99.6 /100 | #63 | Exceptional 19.2% |
| Immigrants | Europe | 99.6 /100 | #64 | Exceptional 19.2% |
| Cypriots | 99.6 /100 | #65 | Exceptional 19.2% |
| Palestinians | 99.6 /100 | #66 | Exceptional 19.2% |
| Immigrants | Egypt | 99.6 /100 | #67 | Exceptional 19.2% |
| Laotians | 99.5 /100 | #68 | Exceptional 19.3% |
| Paraguayans | 99.5 /100 | #69 | Exceptional 19.3% |
Demographics Similar to Danes by Single Female Poverty
In terms of single female poverty, the demographic groups most similar to Danes are Costa Rican (20.7%, a difference of 0.090%), Immigrants from Oceania (20.7%, a difference of 0.11%), Arab (20.7%, a difference of 0.17%), South American Indian (20.6%, a difference of 0.22%), and Samoan (20.6%, a difference of 0.26%).
| Demographics | Rating | Rank | Single Female Poverty |
| Puget Sound Salish | 79.6 /100 | #151 | Good 20.6% |
| Immigrants | Uruguay | 77.7 /100 | #152 | Good 20.6% |
| Swedes | 77.1 /100 | #153 | Good 20.6% |
| Immigrants | Western Europe | 76.7 /100 | #154 | Good 20.6% |
| Samoans | 76.0 /100 | #155 | Good 20.6% |
| South American Indians | 75.7 /100 | #156 | Good 20.6% |
| Immigrants | Oceania | 74.3 /100 | #157 | Good 20.7% |
| Danes | 73.0 /100 | #158 | Good 20.7% |
| Costa Ricans | 71.8 /100 | #159 | Good 20.7% |
| Arabs | 70.8 /100 | #160 | Good 20.7% |
| Kenyans | 68.5 /100 | #161 | Good 20.8% |
| Northern Europeans | 68.4 /100 | #162 | Good 20.8% |
| Lebanese | 67.6 /100 | #163 | Good 20.8% |
| Iraqis | 64.5 /100 | #164 | Good 20.8% |
| Ugandans | 64.0 /100 | #165 | Good 20.8% |