Lithuanian vs Immigrants from Austria Single Female Poverty
COMPARE
Lithuanian
Immigrants from Austria
Single Female Poverty
Single Female Poverty Comparison
Lithuanians
Immigrants from Austria
19.2%
SINGLE FEMALE POVERTY
99.6/ 100
METRIC RATING
62nd/ 347
METRIC RANK
19.6%
SINGLE FEMALE POVERTY
98.8/ 100
METRIC RATING
93rd/ 347
METRIC RANK
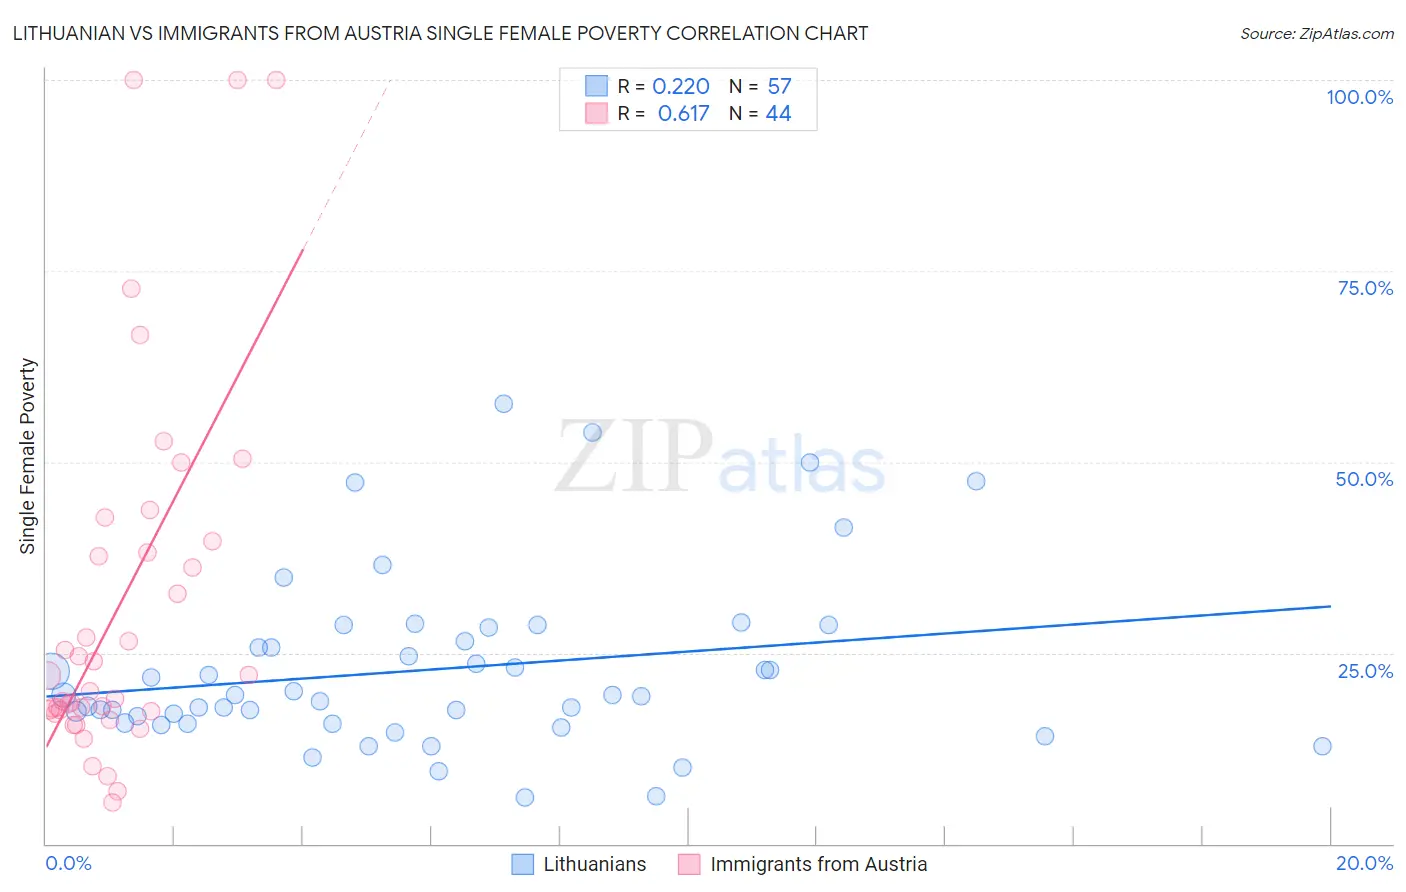
Lithuanian vs Immigrants from Austria Single Female Poverty Correlation Chart
The statistical analysis conducted on geographies consisting of 412,150,693 people shows a weak positive correlation between the proportion of Lithuanians and poverty level among single females in the United States with a correlation coefficient (R) of 0.220 and weighted average of 19.2%. Similarly, the statistical analysis conducted on geographies consisting of 166,235,913 people shows a significant positive correlation between the proportion of Immigrants from Austria and poverty level among single females in the United States with a correlation coefficient (R) of 0.617 and weighted average of 19.6%, a difference of 2.0%.
Single Female Poverty Correlation Summary
| Measurement | Lithuanian | Immigrants from Austria |
| Minimum | 6.1% | 5.5% |
| Maximum | 57.6% | 100.0% |
| Range | 51.5% | 94.5% |
| Mean | 22.8% | 31.3% |
| Median | 19.4% | 21.0% |
| Interquartile 25% (IQ1) | 15.7% | 17.4% |
| Interquartile 75% (IQ3) | 27.4% | 38.9% |
| Interquartile Range (IQR) | 11.7% | 21.4% |
| Standard Deviation (Sample) | 11.3% | 24.1% |
| Standard Deviation (Population) | 11.2% | 23.8% |
Similar Demographics by Single Female Poverty
Demographics Similar to Lithuanians by Single Female Poverty
In terms of single female poverty, the demographic groups most similar to Lithuanians are Cambodian (19.2%, a difference of 0.050%), Russian (19.2%, a difference of 0.070%), Immigrants from Northern Europe (19.2%, a difference of 0.12%), Immigrants from Europe (19.2%, a difference of 0.13%), and Cypriot (19.2%, a difference of 0.15%).
| Demographics | Rating | Rank | Single Female Poverty |
| Immigrants | Vietnam | 99.7 /100 | #55 | Exceptional 19.1% |
| Immigrants | Fiji | 99.7 /100 | #56 | Exceptional 19.1% |
| Eastern Europeans | 99.7 /100 | #57 | Exceptional 19.1% |
| Immigrants | Bulgaria | 99.7 /100 | #58 | Exceptional 19.1% |
| Sri Lankans | 99.6 /100 | #59 | Exceptional 19.2% |
| Russians | 99.6 /100 | #60 | Exceptional 19.2% |
| Cambodians | 99.6 /100 | #61 | Exceptional 19.2% |
| Lithuanians | 99.6 /100 | #62 | Exceptional 19.2% |
| Immigrants | Northern Europe | 99.6 /100 | #63 | Exceptional 19.2% |
| Immigrants | Europe | 99.6 /100 | #64 | Exceptional 19.2% |
| Cypriots | 99.6 /100 | #65 | Exceptional 19.2% |
| Palestinians | 99.6 /100 | #66 | Exceptional 19.2% |
| Immigrants | Egypt | 99.6 /100 | #67 | Exceptional 19.2% |
| Laotians | 99.5 /100 | #68 | Exceptional 19.3% |
| Paraguayans | 99.5 /100 | #69 | Exceptional 19.3% |
Demographics Similar to Immigrants from Austria by Single Female Poverty
In terms of single female poverty, the demographic groups most similar to Immigrants from Austria are Italian (19.6%, a difference of 0.010%), Soviet Union (19.6%, a difference of 0.060%), Immigrants from Lebanon (19.6%, a difference of 0.12%), Romanian (19.6%, a difference of 0.22%), and Immigrants from Ukraine (19.5%, a difference of 0.30%).
| Demographics | Rating | Rank | Single Female Poverty |
| Greeks | 99.2 /100 | #86 | Exceptional 19.4% |
| Zimbabweans | 99.0 /100 | #87 | Exceptional 19.5% |
| Afghans | 99.0 /100 | #88 | Exceptional 19.5% |
| Immigrants | Ukraine | 99.0 /100 | #89 | Exceptional 19.5% |
| Immigrants | Lebanon | 98.8 /100 | #90 | Exceptional 19.6% |
| Soviet Union | 98.8 /100 | #91 | Exceptional 19.6% |
| Italians | 98.8 /100 | #92 | Exceptional 19.6% |
| Immigrants | Austria | 98.8 /100 | #93 | Exceptional 19.6% |
| Romanians | 98.6 /100 | #94 | Exceptional 19.6% |
| Estonians | 98.2 /100 | #95 | Exceptional 19.7% |
| Immigrants | Brazil | 98.2 /100 | #96 | Exceptional 19.7% |
| Croatians | 98.1 /100 | #97 | Exceptional 19.7% |
| Immigrants | France | 97.9 /100 | #98 | Exceptional 19.7% |
| Sierra Leoneans | 97.9 /100 | #99 | Exceptional 19.7% |
| Ukrainians | 97.6 /100 | #100 | Exceptional 19.8% |