Lithuanian vs Immigrants from Ireland In Labor Force | Age 16-19
COMPARE
Lithuanian
Immigrants from Ireland
In Labor Force | Age 16-19
In Labor Force | Age 16-19 Comparison
Lithuanians
Immigrants from Ireland
40.4%
IN LABOR FORCE | AGE 16-19
100.0/ 100
METRIC RATING
57th/ 347
METRIC RANK
35.0%
IN LABOR FORCE | AGE 16-19
2.9/ 100
METRIC RATING
241st/ 347
METRIC RANK
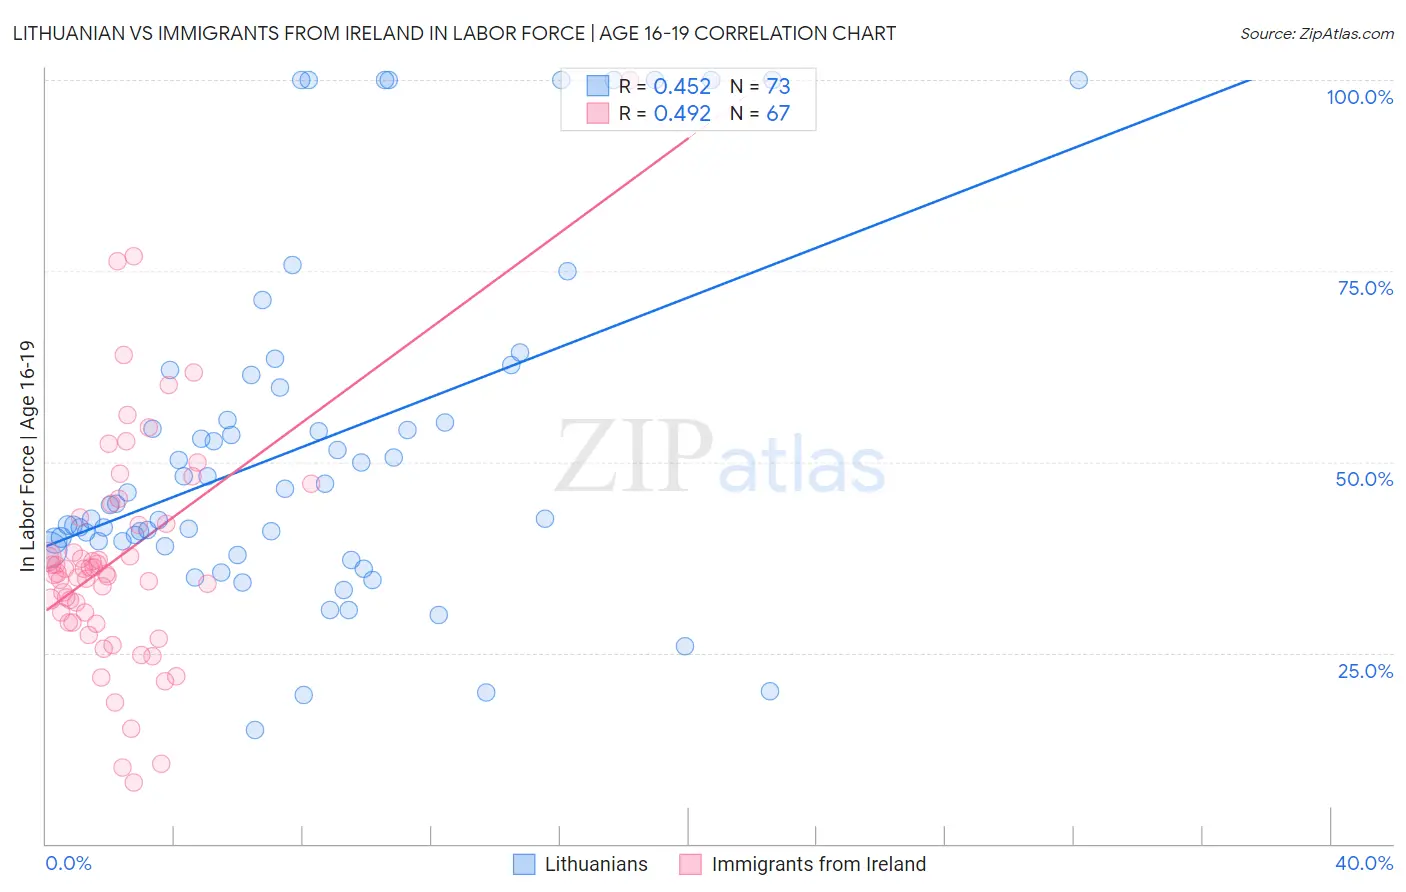
Lithuanian vs Immigrants from Ireland In Labor Force | Age 16-19 Correlation Chart
The statistical analysis conducted on geographies consisting of 420,922,487 people shows a moderate positive correlation between the proportion of Lithuanians and labor force participation rate among population between the ages 16 and 19 in the United States with a correlation coefficient (R) of 0.452 and weighted average of 40.4%. Similarly, the statistical analysis conducted on geographies consisting of 240,424,944 people shows a moderate positive correlation between the proportion of Immigrants from Ireland and labor force participation rate among population between the ages 16 and 19 in the United States with a correlation coefficient (R) of 0.492 and weighted average of 35.0%, a difference of 15.7%.
In Labor Force | Age 16-19 Correlation Summary
| Measurement | Lithuanian | Immigrants from Ireland |
| Minimum | 15.0% | 8.0% |
| Maximum | 100.0% | 100.0% |
| Range | 85.0% | 92.0% |
| Mean | 52.1% | 37.6% |
| Median | 44.5% | 35.5% |
| Interquartile 25% (IQ1) | 39.3% | 29.0% |
| Interquartile 75% (IQ3) | 60.6% | 42.8% |
| Interquartile Range (IQR) | 21.2% | 13.8% |
| Standard Deviation (Sample) | 22.6% | 15.5% |
| Standard Deviation (Population) | 22.4% | 15.4% |
Similar Demographics by In Labor Force | Age 16-19
Demographics Similar to Lithuanians by In Labor Force | Age 16-19
In terms of in labor force | age 16-19, the demographic groups most similar to Lithuanians are Aleut (40.4%, a difference of 0.010%), Fijian (40.4%, a difference of 0.030%), British (40.5%, a difference of 0.11%), Tlingit-Haida (40.5%, a difference of 0.14%), and Slavic (40.4%, a difference of 0.15%).
| Demographics | Rating | Rank | In Labor Force | Age 16-19 |
| Indonesians | 100.0 /100 | #50 | Exceptional 40.7% |
| Immigrants | Zaire | 100.0 /100 | #51 | Exceptional 40.7% |
| Immigrants | Laos | 100.0 /100 | #52 | Exceptional 40.6% |
| Immigrants | Kenya | 100.0 /100 | #53 | Exceptional 40.5% |
| Tlingit-Haida | 100.0 /100 | #54 | Exceptional 40.5% |
| British | 100.0 /100 | #55 | Exceptional 40.5% |
| Fijians | 100.0 /100 | #56 | Exceptional 40.4% |
| Lithuanians | 100.0 /100 | #57 | Exceptional 40.4% |
| Aleuts | 100.0 /100 | #58 | Exceptional 40.4% |
| Slavs | 100.0 /100 | #59 | Exceptional 40.4% |
| Immigrants | Eastern Africa | 100.0 /100 | #60 | Exceptional 40.4% |
| Americans | 100.0 /100 | #61 | Exceptional 40.3% |
| Cherokee | 100.0 /100 | #62 | Exceptional 40.2% |
| Northern Europeans | 100.0 /100 | #63 | Exceptional 40.2% |
| Immigrants | Micronesia | 100.0 /100 | #64 | Exceptional 40.2% |
Demographics Similar to Immigrants from Ireland by In Labor Force | Age 16-19
In terms of in labor force | age 16-19, the demographic groups most similar to Immigrants from Ireland are Immigrants from Central America (35.0%, a difference of 0.030%), Inupiat (35.0%, a difference of 0.13%), Uruguayan (34.9%, a difference of 0.13%), Pueblo (34.9%, a difference of 0.15%), and Immigrants from Turkey (34.9%, a difference of 0.17%).
| Demographics | Rating | Rank | In Labor Force | Age 16-19 |
| Immigrants | Mexico | 4.2 /100 | #234 | Tragic 35.1% |
| Immigrants | Philippines | 4.0 /100 | #235 | Tragic 35.1% |
| Immigrants | Australia | 3.6 /100 | #236 | Tragic 35.1% |
| Immigrants | India | 3.5 /100 | #237 | Tragic 35.0% |
| Immigrants | Vietnam | 3.4 /100 | #238 | Tragic 35.0% |
| Inupiat | 3.2 /100 | #239 | Tragic 35.0% |
| Immigrants | Central America | 3.0 /100 | #240 | Tragic 35.0% |
| Immigrants | Ireland | 2.9 /100 | #241 | Tragic 35.0% |
| Uruguayans | 2.6 /100 | #242 | Tragic 34.9% |
| Pueblo | 2.6 /100 | #243 | Tragic 34.9% |
| Immigrants | Turkey | 2.6 /100 | #244 | Tragic 34.9% |
| Immigrants | Greece | 2.4 /100 | #245 | Tragic 34.9% |
| Immigrants | Sri Lanka | 2.4 /100 | #246 | Tragic 34.9% |
| Laotians | 2.4 /100 | #247 | Tragic 34.9% |
| Central Americans | 2.2 /100 | #248 | Tragic 34.8% |