Lithuanian vs Immigrants from Ireland Poverty
COMPARE
Lithuanian
Immigrants from Ireland
Poverty
Poverty Comparison
Lithuanians
Immigrants from Ireland
10.5%
POVERTY
99.8/ 100
METRIC RATING
16th/ 347
METRIC RANK
10.1%
POVERTY
99.9/ 100
METRIC RATING
5th/ 347
METRIC RANK
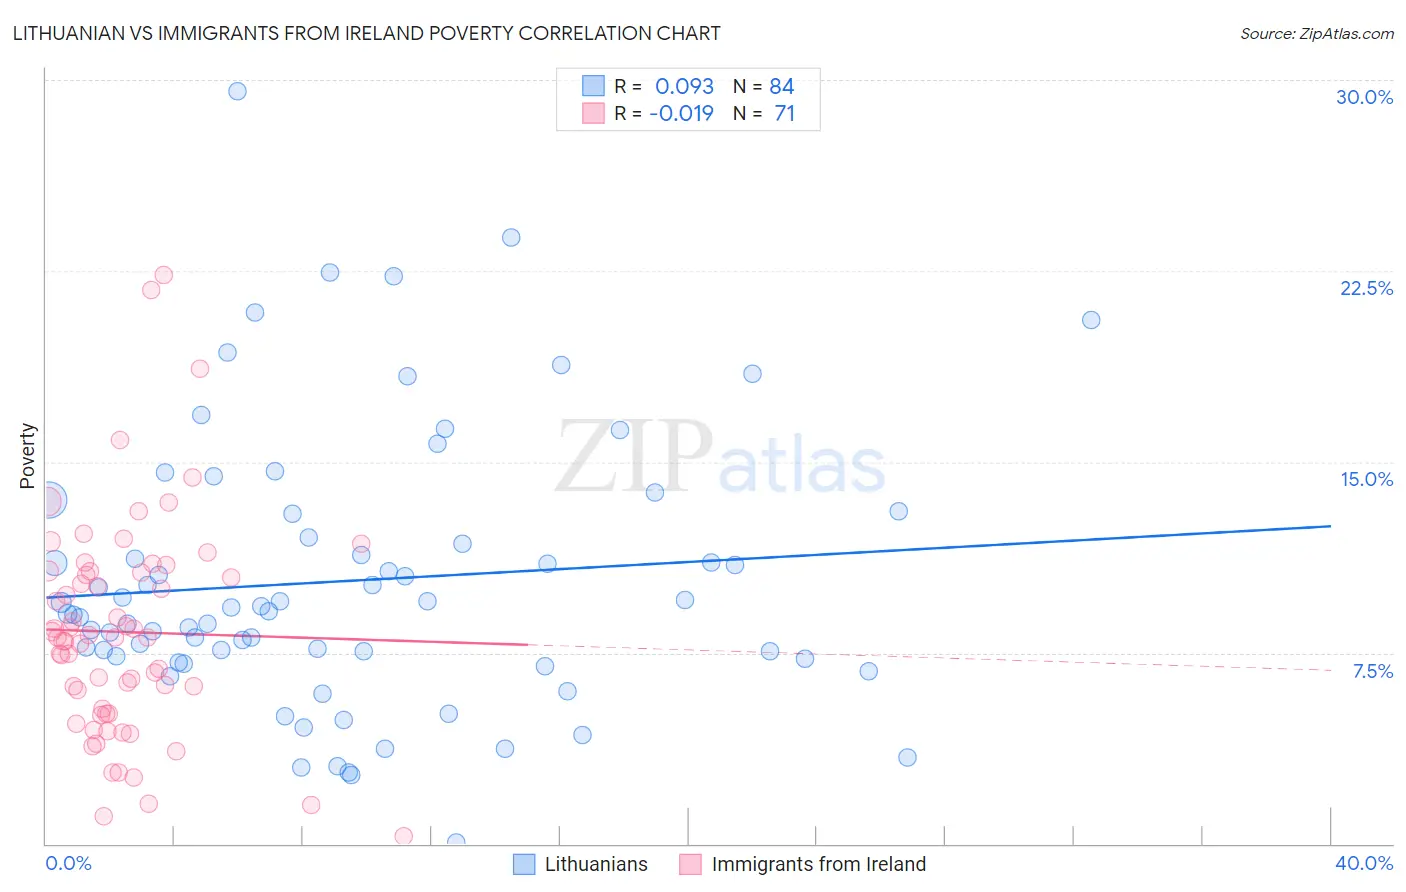
Lithuanian vs Immigrants from Ireland Poverty Correlation Chart
The statistical analysis conducted on geographies consisting of 421,719,572 people shows a slight positive correlation between the proportion of Lithuanians and poverty level in the United States with a correlation coefficient (R) of 0.093 and weighted average of 10.5%. Similarly, the statistical analysis conducted on geographies consisting of 240,745,110 people shows no correlation between the proportion of Immigrants from Ireland and poverty level in the United States with a correlation coefficient (R) of -0.019 and weighted average of 10.1%, a difference of 3.8%.
Poverty Correlation Summary
| Measurement | Lithuanian | Immigrants from Ireland |
| Minimum | 0.071% | 0.31% |
| Maximum | 29.6% | 22.3% |
| Range | 29.5% | 22.0% |
| Mean | 10.3% | 8.3% |
| Median | 9.2% | 8.1% |
| Interquartile 25% (IQ1) | 7.3% | 5.1% |
| Interquartile 75% (IQ3) | 12.5% | 10.7% |
| Interquartile Range (IQR) | 5.2% | 5.6% |
| Standard Deviation (Sample) | 5.4% | 4.3% |
| Standard Deviation (Population) | 5.4% | 4.3% |
Demographics Similar to Lithuanians and Immigrants from Ireland by Poverty
In terms of poverty, the demographic groups most similar to Lithuanians are Bolivian (10.4%, a difference of 0.30%), Immigrants from Bolivia (10.4%, a difference of 0.31%), Norwegian (10.5%, a difference of 0.37%), Latvian (10.5%, a difference of 0.46%), and Immigrants from Hong Kong (10.4%, a difference of 0.62%). Similarly, the demographic groups most similar to Immigrants from Ireland are Assyrian/Chaldean/Syriac (10.1%, a difference of 0.18%), Filipino (10.1%, a difference of 0.32%), Maltese (10.2%, a difference of 0.74%), Immigrants from South Central Asia (10.2%, a difference of 1.2%), and Bulgarian (10.2%, a difference of 1.6%).
| Demographics | Rating | Rank | Poverty |
| Immigrants | India | 100.0 /100 | #1 | Exceptional 9.0% |
| Chinese | 100.0 /100 | #2 | Exceptional 9.5% |
| Thais | 100.0 /100 | #3 | Exceptional 9.6% |
| Immigrants | Taiwan | 100.0 /100 | #4 | Exceptional 9.7% |
| Immigrants | Ireland | 99.9 /100 | #5 | Exceptional 10.1% |
| Assyrians/Chaldeans/Syriacs | 99.9 /100 | #6 | Exceptional 10.1% |
| Filipinos | 99.9 /100 | #7 | Exceptional 10.1% |
| Maltese | 99.9 /100 | #8 | Exceptional 10.2% |
| Immigrants | South Central Asia | 99.9 /100 | #9 | Exceptional 10.2% |
| Bulgarians | 99.9 /100 | #10 | Exceptional 10.2% |
| Immigrants | Lithuania | 99.9 /100 | #11 | Exceptional 10.3% |
| Bhutanese | 99.8 /100 | #12 | Exceptional 10.4% |
| Immigrants | Hong Kong | 99.8 /100 | #13 | Exceptional 10.4% |
| Immigrants | Bolivia | 99.8 /100 | #14 | Exceptional 10.4% |
| Bolivians | 99.8 /100 | #15 | Exceptional 10.4% |
| Lithuanians | 99.8 /100 | #16 | Exceptional 10.5% |
| Norwegians | 99.8 /100 | #17 | Exceptional 10.5% |
| Latvians | 99.8 /100 | #18 | Exceptional 10.5% |
| Immigrants | Scotland | 99.7 /100 | #19 | Exceptional 10.6% |
| Immigrants | North Macedonia | 99.7 /100 | #20 | Exceptional 10.6% |