Jamaican vs Tongan Married-Couple Family Poverty
COMPARE
Jamaican
Tongan
Married-Couple Family Poverty
Married-Couple Family Poverty Comparison
Jamaicans
Tongans
6.1%
MARRIED-COUPLE FAMILY POVERTY
0.3/ 100
METRIC RATING
260th/ 347
METRIC RANK
4.7%
MARRIED-COUPLE FAMILY POVERTY
95.9/ 100
METRIC RATING
112th/ 347
METRIC RANK
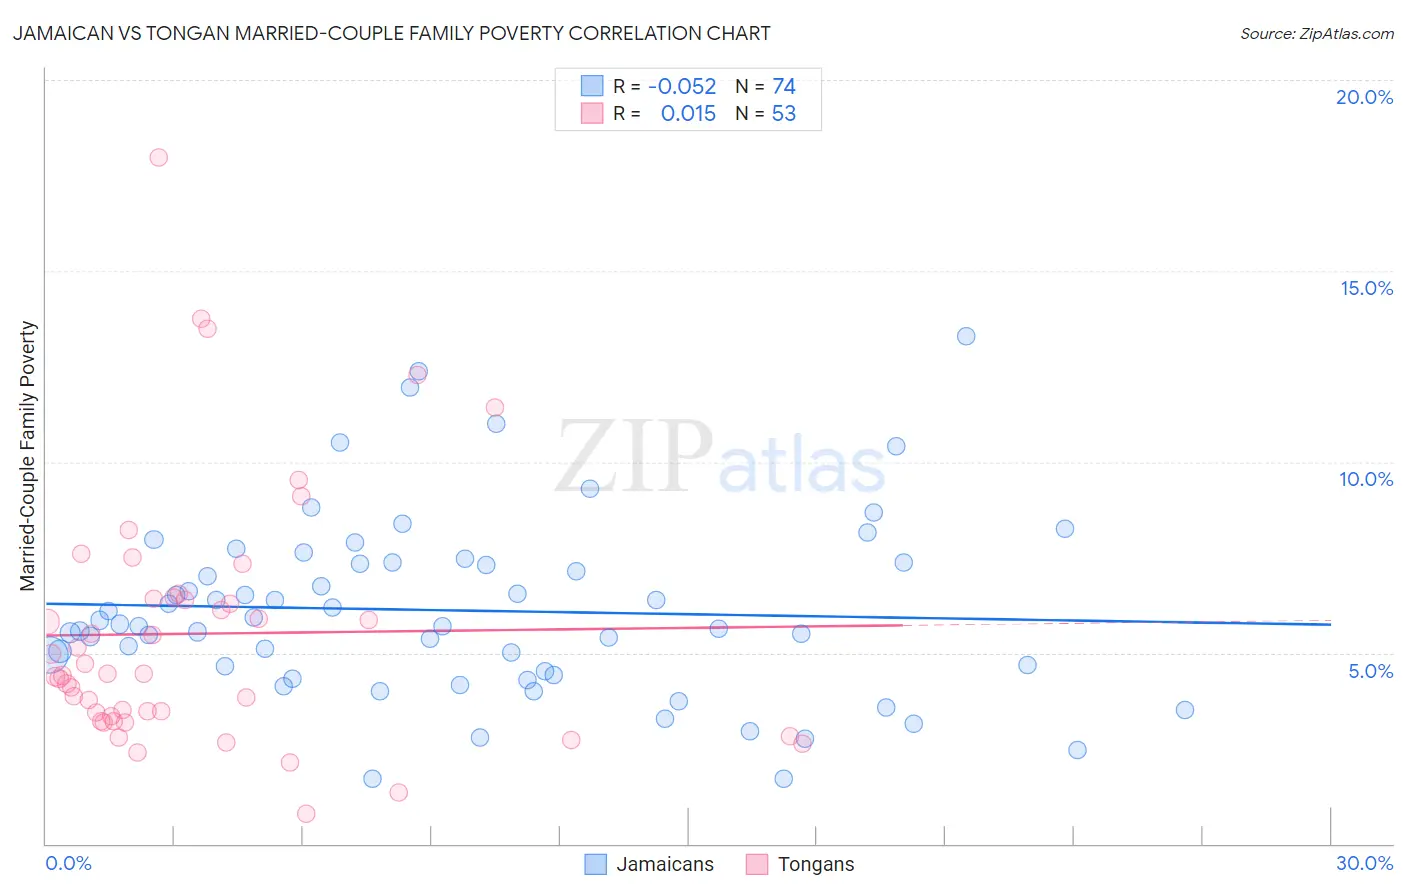
Jamaican vs Tongan Married-Couple Family Poverty Correlation Chart
The statistical analysis conducted on geographies consisting of 364,819,345 people shows a slight negative correlation between the proportion of Jamaicans and poverty level among married-couple families in the United States with a correlation coefficient (R) of -0.052 and weighted average of 6.1%. Similarly, the statistical analysis conducted on geographies consisting of 102,697,029 people shows no correlation between the proportion of Tongans and poverty level among married-couple families in the United States with a correlation coefficient (R) of 0.015 and weighted average of 4.7%, a difference of 28.2%.
Married-Couple Family Poverty Correlation Summary
| Measurement | Jamaican | Tongan |
| Minimum | 1.7% | 0.80% |
| Maximum | 13.3% | 18.0% |
| Range | 11.6% | 17.2% |
| Mean | 6.1% | 5.5% |
| Median | 5.7% | 4.4% |
| Interquartile 25% (IQ1) | 4.5% | 3.3% |
| Interquartile 75% (IQ3) | 7.4% | 6.4% |
| Interquartile Range (IQR) | 2.8% | 3.2% |
| Standard Deviation (Sample) | 2.4% | 3.3% |
| Standard Deviation (Population) | 2.4% | 3.3% |
Similar Demographics by Married-Couple Family Poverty
Demographics Similar to Jamaicans by Married-Couple Family Poverty
In terms of married-couple family poverty, the demographic groups most similar to Jamaicans are Senegalese (6.1%, a difference of 0.19%), Alaskan Athabascan (6.1%, a difference of 0.21%), Shoshone (6.1%, a difference of 0.40%), Immigrants (6.0%, a difference of 0.79%), and Immigrants from Senegal (6.1%, a difference of 0.79%).
| Demographics | Rating | Rank | Married-Couple Family Poverty |
| Africans | 0.7 /100 | #253 | Tragic 6.0% |
| Immigrants | Somalia | 0.7 /100 | #254 | Tragic 6.0% |
| Comanche | 0.7 /100 | #255 | Tragic 6.0% |
| Bangladeshis | 0.5 /100 | #256 | Tragic 6.0% |
| Immigrants | Burma/Myanmar | 0.5 /100 | #257 | Tragic 6.0% |
| Immigrants | Immigrants | 0.5 /100 | #258 | Tragic 6.0% |
| Alaskan Athabascans | 0.4 /100 | #259 | Tragic 6.1% |
| Jamaicans | 0.3 /100 | #260 | Tragic 6.1% |
| Senegalese | 0.3 /100 | #261 | Tragic 6.1% |
| Shoshone | 0.3 /100 | #262 | Tragic 6.1% |
| Immigrants | Senegal | 0.3 /100 | #263 | Tragic 6.1% |
| Immigrants | Congo | 0.2 /100 | #264 | Tragic 6.1% |
| Blackfeet | 0.2 /100 | #265 | Tragic 6.2% |
| Creek | 0.2 /100 | #266 | Tragic 6.2% |
| Spanish Americans | 0.2 /100 | #267 | Tragic 6.2% |
Demographics Similar to Tongans by Married-Couple Family Poverty
In terms of married-couple family poverty, the demographic groups most similar to Tongans are Immigrants from Nepal (4.7%, a difference of 0.070%), Pakistani (4.7%, a difference of 0.18%), Immigrants from Bolivia (4.7%, a difference of 0.22%), Immigrants from Hong Kong (4.7%, a difference of 0.38%), and Laotian (4.7%, a difference of 0.58%).
| Demographics | Rating | Rank | Married-Couple Family Poverty |
| Aleuts | 97.0 /100 | #105 | Exceptional 4.7% |
| Immigrants | France | 96.9 /100 | #106 | Exceptional 4.7% |
| Immigrants | Germany | 96.8 /100 | #107 | Exceptional 4.7% |
| Laotians | 96.6 /100 | #108 | Exceptional 4.7% |
| Immigrants | Hong Kong | 96.4 /100 | #109 | Exceptional 4.7% |
| Immigrants | Bolivia | 96.2 /100 | #110 | Exceptional 4.7% |
| Pakistanis | 96.2 /100 | #111 | Exceptional 4.7% |
| Tongans | 95.9 /100 | #112 | Exceptional 4.7% |
| Immigrants | Nepal | 95.9 /100 | #113 | Exceptional 4.7% |
| Immigrants | Indonesia | 95.1 /100 | #114 | Exceptional 4.8% |
| Taiwanese | 94.8 /100 | #115 | Exceptional 4.8% |
| Celtics | 94.8 /100 | #116 | Exceptional 4.8% |
| Kenyans | 94.7 /100 | #117 | Exceptional 4.8% |
| Immigrants | Philippines | 94.6 /100 | #118 | Exceptional 4.8% |
| Immigrants | Eastern Asia | 94.0 /100 | #119 | Exceptional 4.8% |