Jamaican vs Ugandan Married-Couple Family Poverty
COMPARE
Jamaican
Ugandan
Married-Couple Family Poverty
Married-Couple Family Poverty Comparison
Jamaicans
Ugandans
6.1%
MARRIED-COUPLE FAMILY POVERTY
0.3/ 100
METRIC RATING
260th/ 347
METRIC RANK
5.3%
MARRIED-COUPLE FAMILY POVERTY
31.6/ 100
METRIC RATING
190th/ 347
METRIC RANK
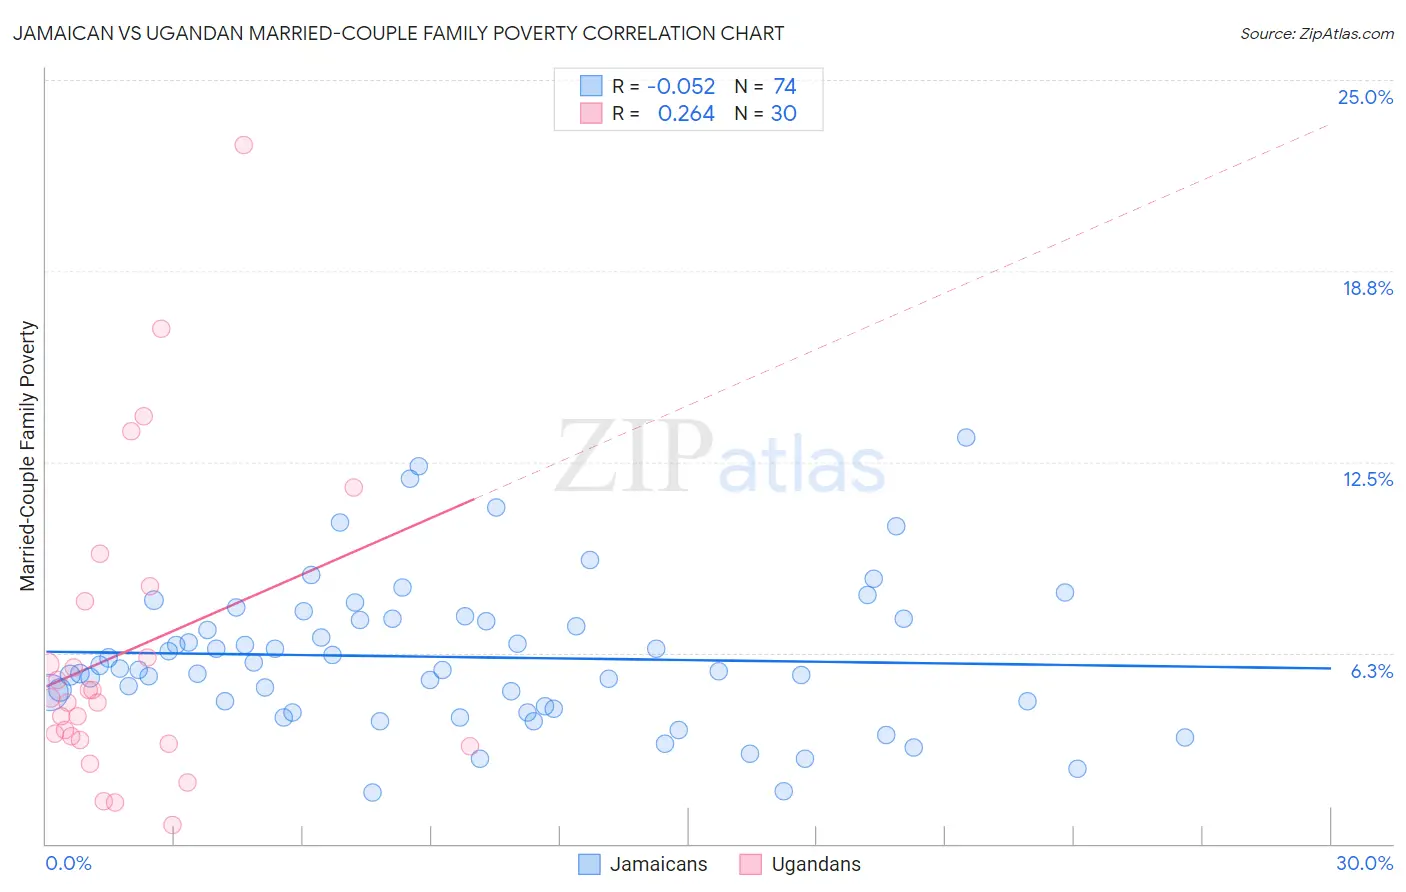
Jamaican vs Ugandan Married-Couple Family Poverty Correlation Chart
The statistical analysis conducted on geographies consisting of 364,819,345 people shows a slight negative correlation between the proportion of Jamaicans and poverty level among married-couple families in the United States with a correlation coefficient (R) of -0.052 and weighted average of 6.1%. Similarly, the statistical analysis conducted on geographies consisting of 93,779,769 people shows a weak positive correlation between the proportion of Ugandans and poverty level among married-couple families in the United States with a correlation coefficient (R) of 0.264 and weighted average of 5.3%, a difference of 13.9%.
Married-Couple Family Poverty Correlation Summary
| Measurement | Jamaican | Ugandan |
| Minimum | 1.7% | 0.62% |
| Maximum | 13.3% | 22.9% |
| Range | 11.6% | 22.2% |
| Mean | 6.1% | 6.3% |
| Median | 5.7% | 4.7% |
| Interquartile 25% (IQ1) | 4.5% | 3.4% |
| Interquartile 75% (IQ3) | 7.4% | 7.9% |
| Interquartile Range (IQR) | 2.8% | 4.5% |
| Standard Deviation (Sample) | 2.4% | 5.0% |
| Standard Deviation (Population) | 2.4% | 4.9% |
Similar Demographics by Married-Couple Family Poverty
Demographics Similar to Jamaicans by Married-Couple Family Poverty
In terms of married-couple family poverty, the demographic groups most similar to Jamaicans are Senegalese (6.1%, a difference of 0.19%), Alaskan Athabascan (6.1%, a difference of 0.21%), Shoshone (6.1%, a difference of 0.40%), Immigrants (6.0%, a difference of 0.79%), and Immigrants from Senegal (6.1%, a difference of 0.79%).
| Demographics | Rating | Rank | Married-Couple Family Poverty |
| Africans | 0.7 /100 | #253 | Tragic 6.0% |
| Immigrants | Somalia | 0.7 /100 | #254 | Tragic 6.0% |
| Comanche | 0.7 /100 | #255 | Tragic 6.0% |
| Bangladeshis | 0.5 /100 | #256 | Tragic 6.0% |
| Immigrants | Burma/Myanmar | 0.5 /100 | #257 | Tragic 6.0% |
| Immigrants | Immigrants | 0.5 /100 | #258 | Tragic 6.0% |
| Alaskan Athabascans | 0.4 /100 | #259 | Tragic 6.1% |
| Jamaicans | 0.3 /100 | #260 | Tragic 6.1% |
| Senegalese | 0.3 /100 | #261 | Tragic 6.1% |
| Shoshone | 0.3 /100 | #262 | Tragic 6.1% |
| Immigrants | Senegal | 0.3 /100 | #263 | Tragic 6.1% |
| Immigrants | Congo | 0.2 /100 | #264 | Tragic 6.1% |
| Blackfeet | 0.2 /100 | #265 | Tragic 6.2% |
| Creek | 0.2 /100 | #266 | Tragic 6.2% |
| Spanish Americans | 0.2 /100 | #267 | Tragic 6.2% |
Demographics Similar to Ugandans by Married-Couple Family Poverty
In terms of married-couple family poverty, the demographic groups most similar to Ugandans are Immigrants from Cabo Verde (5.3%, a difference of 0.090%), South American Indian (5.3%, a difference of 0.11%), Cape Verdean (5.3%, a difference of 0.12%), Israeli (5.3%, a difference of 0.20%), and Immigrants from Albania (5.3%, a difference of 0.29%).
| Demographics | Rating | Rank | Married-Couple Family Poverty |
| Peruvians | 37.6 /100 | #183 | Fair 5.3% |
| Immigrants | Nonimmigrants | 35.8 /100 | #184 | Fair 5.3% |
| Americans | 35.4 /100 | #185 | Fair 5.3% |
| Hungarians | 34.7 /100 | #186 | Fair 5.3% |
| Immigrants | Albania | 33.8 /100 | #187 | Fair 5.3% |
| Israelis | 33.1 /100 | #188 | Fair 5.3% |
| South American Indians | 32.5 /100 | #189 | Fair 5.3% |
| Ugandans | 31.6 /100 | #190 | Fair 5.3% |
| Immigrants | Cabo Verde | 30.9 /100 | #191 | Fair 5.3% |
| Cape Verdeans | 30.7 /100 | #192 | Fair 5.3% |
| Malaysians | 29.5 /100 | #193 | Fair 5.4% |
| Immigrants | Israel | 27.8 /100 | #194 | Fair 5.4% |
| Immigrants | Azores | 27.5 /100 | #195 | Fair 5.4% |
| Spaniards | 27.4 /100 | #196 | Fair 5.4% |
| Liberians | 26.3 /100 | #197 | Fair 5.4% |