Jamaican vs Tongan Disability Age Under 5
COMPARE
Jamaican
Tongan
Disability Age Under 5
Disability Age Under 5 Comparison
Jamaicans
Tongans
1.3%
DISABILITY AGE UNDER 5
30.7/ 100
METRIC RATING
199th/ 347
METRIC RANK
1.3%
DISABILITY AGE UNDER 5
4.2/ 100
METRIC RATING
233rd/ 347
METRIC RANK
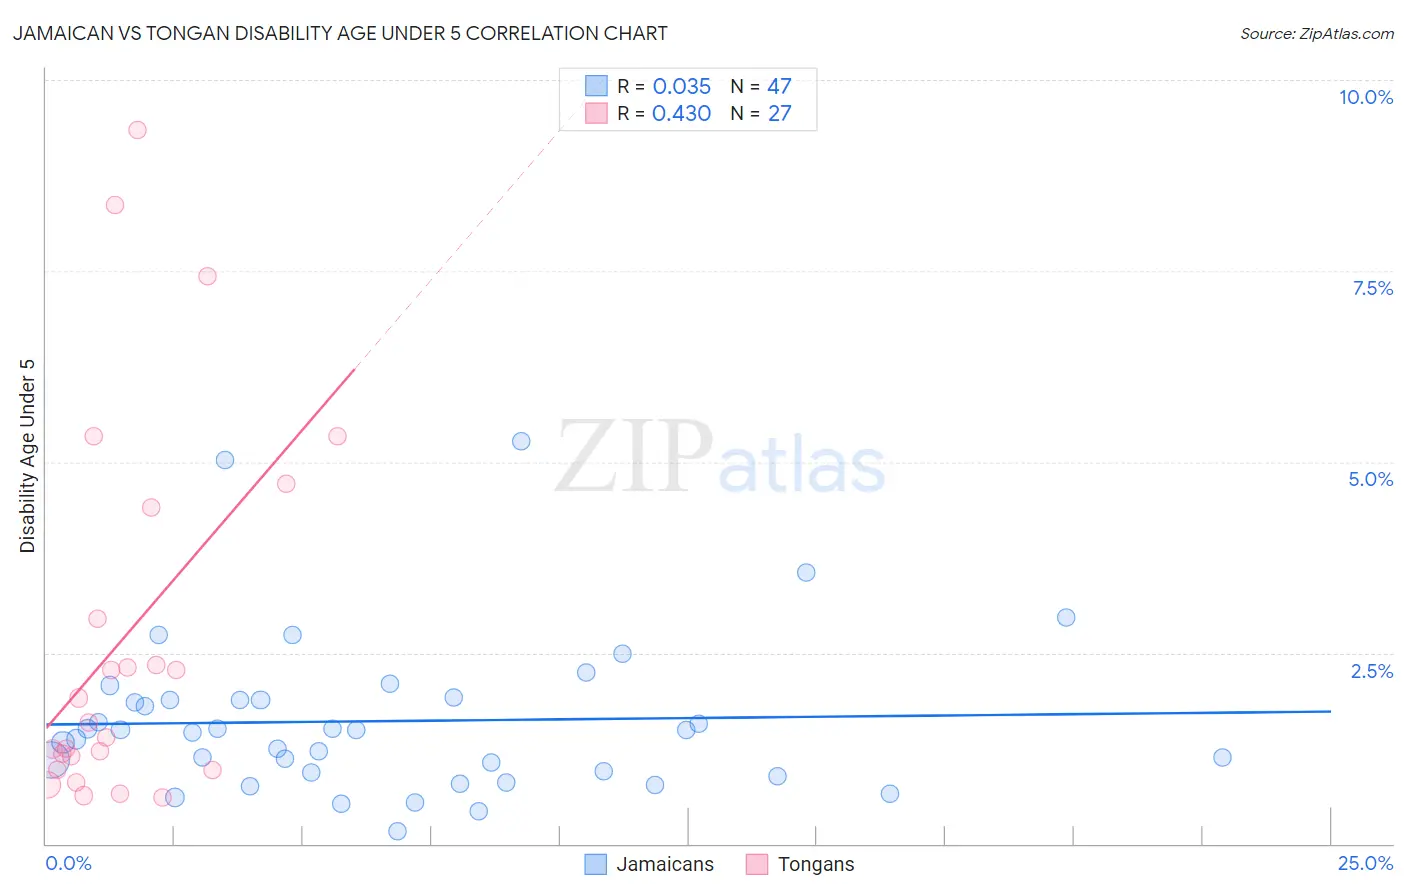
Jamaican vs Tongan Disability Age Under 5 Correlation Chart
The statistical analysis conducted on geographies consisting of 204,154,709 people shows no correlation between the proportion of Jamaicans and percentage of population with a disability under the age of 5 in the United States with a correlation coefficient (R) of 0.035 and weighted average of 1.3%. Similarly, the statistical analysis conducted on geographies consisting of 77,388,700 people shows a moderate positive correlation between the proportion of Tongans and percentage of population with a disability under the age of 5 in the United States with a correlation coefficient (R) of 0.430 and weighted average of 1.3%, a difference of 5.1%.
Disability Age Under 5 Correlation Summary
| Measurement | Jamaican | Tongan |
| Minimum | 0.17% | 0.61% |
| Maximum | 5.3% | 9.3% |
| Range | 5.1% | 8.7% |
| Mean | 1.6% | 2.7% |
| Median | 1.5% | 1.6% |
| Interquartile 25% (IQ1) | 0.93% | 0.97% |
| Interquartile 75% (IQ3) | 1.9% | 4.4% |
| Interquartile Range (IQR) | 0.95% | 3.4% |
| Standard Deviation (Sample) | 1.0% | 2.5% |
| Standard Deviation (Population) | 1.0% | 2.4% |
Similar Demographics by Disability Age Under 5
Demographics Similar to Jamaicans by Disability Age Under 5
In terms of disability age under 5, the demographic groups most similar to Jamaicans are Immigrants from Norway (1.3%, a difference of 0.040%), Immigrants from Somalia (1.3%, a difference of 0.070%), Immigrants from Belgium (1.3%, a difference of 0.080%), U.S. Virgin Islander (1.3%, a difference of 0.38%), and Immigrants from Lithuania (1.3%, a difference of 0.38%).
| Demographics | Rating | Rank | Disability Age Under 5 |
| Immigrants | Bosnia and Herzegovina | 36.5 /100 | #192 | Fair 1.3% |
| Immigrants | Sierra Leone | 36.5 /100 | #193 | Fair 1.3% |
| Immigrants | North Macedonia | 34.7 /100 | #194 | Fair 1.3% |
| U.S. Virgin Islanders | 34.4 /100 | #195 | Fair 1.3% |
| Immigrants | Belgium | 31.4 /100 | #196 | Fair 1.3% |
| Immigrants | Somalia | 31.3 /100 | #197 | Fair 1.3% |
| Immigrants | Norway | 31.1 /100 | #198 | Fair 1.3% |
| Jamaicans | 30.7 /100 | #199 | Fair 1.3% |
| Immigrants | Lithuania | 27.2 /100 | #200 | Fair 1.3% |
| Immigrants | Italy | 25.4 /100 | #201 | Fair 1.3% |
| Arapaho | 24.1 /100 | #202 | Fair 1.3% |
| Liberians | 24.0 /100 | #203 | Fair 1.3% |
| Immigrants | Europe | 23.6 /100 | #204 | Fair 1.3% |
| Romanians | 22.5 /100 | #205 | Fair 1.3% |
| Immigrants | Poland | 22.4 /100 | #206 | Fair 1.3% |
Demographics Similar to Tongans by Disability Age Under 5
In terms of disability age under 5, the demographic groups most similar to Tongans are French American Indian (1.3%, a difference of 0.12%), Immigrants from Northern Europe (1.3%, a difference of 0.25%), Pueblo (1.3%, a difference of 0.26%), Central American Indian (1.3%, a difference of 0.33%), and Lebanese (1.3%, a difference of 0.49%).
| Demographics | Rating | Rank | Disability Age Under 5 |
| Bahamians | 7.1 /100 | #226 | Tragic 1.3% |
| Taiwanese | 6.1 /100 | #227 | Tragic 1.3% |
| Luxembourgers | 6.1 /100 | #228 | Tragic 1.3% |
| Immigrants | Costa Rica | 5.5 /100 | #229 | Tragic 1.3% |
| Lebanese | 5.3 /100 | #230 | Tragic 1.3% |
| Immigrants | Northern Europe | 4.7 /100 | #231 | Tragic 1.3% |
| French American Indians | 4.5 /100 | #232 | Tragic 1.3% |
| Tongans | 4.2 /100 | #233 | Tragic 1.3% |
| Pueblo | 3.8 /100 | #234 | Tragic 1.3% |
| Central American Indians | 3.6 /100 | #235 | Tragic 1.3% |
| South American Indians | 3.3 /100 | #236 | Tragic 1.3% |
| Basques | 3.0 /100 | #237 | Tragic 1.3% |
| Spanish American Indians | 2.4 /100 | #238 | Tragic 1.3% |
| Immigrants | Austria | 2.3 /100 | #239 | Tragic 1.3% |
| Native Hawaiians | 2.2 /100 | #240 | Tragic 1.3% |