Jamaican vs Russian Married-Couple Family Poverty
COMPARE
Jamaican
Russian
Married-Couple Family Poverty
Married-Couple Family Poverty Comparison
Jamaicans
Russians
6.1%
MARRIED-COUPLE FAMILY POVERTY
0.3/ 100
METRIC RATING
260th/ 347
METRIC RANK
4.3%
MARRIED-COUPLE FAMILY POVERTY
99.7/ 100
METRIC RATING
52nd/ 347
METRIC RANK
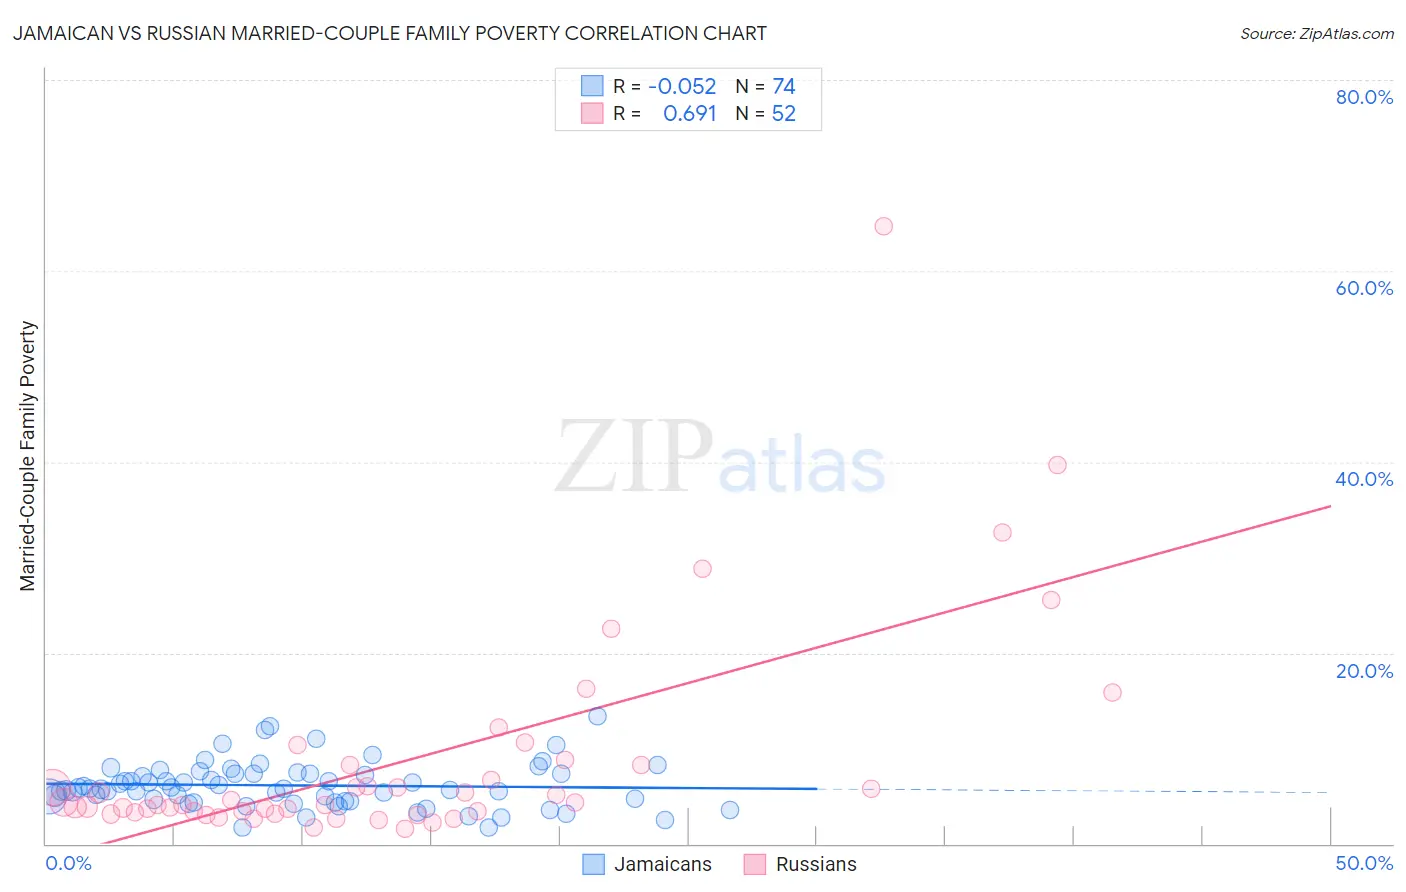
Jamaican vs Russian Married-Couple Family Poverty Correlation Chart
The statistical analysis conducted on geographies consisting of 364,819,345 people shows a slight negative correlation between the proportion of Jamaicans and poverty level among married-couple families in the United States with a correlation coefficient (R) of -0.052 and weighted average of 6.1%. Similarly, the statistical analysis conducted on geographies consisting of 502,513,768 people shows a significant positive correlation between the proportion of Russians and poverty level among married-couple families in the United States with a correlation coefficient (R) of 0.691 and weighted average of 4.3%, a difference of 40.7%.
Married-Couple Family Poverty Correlation Summary
| Measurement | Jamaican | Russian |
| Minimum | 1.7% | 1.6% |
| Maximum | 13.3% | 64.7% |
| Range | 11.6% | 63.1% |
| Mean | 6.1% | 8.7% |
| Median | 5.7% | 4.1% |
| Interquartile 25% (IQ1) | 4.5% | 3.3% |
| Interquartile 75% (IQ3) | 7.4% | 8.3% |
| Interquartile Range (IQR) | 2.8% | 5.0% |
| Standard Deviation (Sample) | 2.4% | 11.4% |
| Standard Deviation (Population) | 2.4% | 11.3% |
Similar Demographics by Married-Couple Family Poverty
Demographics Similar to Jamaicans by Married-Couple Family Poverty
In terms of married-couple family poverty, the demographic groups most similar to Jamaicans are Senegalese (6.1%, a difference of 0.19%), Alaskan Athabascan (6.1%, a difference of 0.21%), Shoshone (6.1%, a difference of 0.40%), Immigrants (6.0%, a difference of 0.79%), and Immigrants from Senegal (6.1%, a difference of 0.79%).
| Demographics | Rating | Rank | Married-Couple Family Poverty |
| Africans | 0.7 /100 | #253 | Tragic 6.0% |
| Immigrants | Somalia | 0.7 /100 | #254 | Tragic 6.0% |
| Comanche | 0.7 /100 | #255 | Tragic 6.0% |
| Bangladeshis | 0.5 /100 | #256 | Tragic 6.0% |
| Immigrants | Burma/Myanmar | 0.5 /100 | #257 | Tragic 6.0% |
| Immigrants | Immigrants | 0.5 /100 | #258 | Tragic 6.0% |
| Alaskan Athabascans | 0.4 /100 | #259 | Tragic 6.1% |
| Jamaicans | 0.3 /100 | #260 | Tragic 6.1% |
| Senegalese | 0.3 /100 | #261 | Tragic 6.1% |
| Shoshone | 0.3 /100 | #262 | Tragic 6.1% |
| Immigrants | Senegal | 0.3 /100 | #263 | Tragic 6.1% |
| Immigrants | Congo | 0.2 /100 | #264 | Tragic 6.1% |
| Blackfeet | 0.2 /100 | #265 | Tragic 6.2% |
| Creek | 0.2 /100 | #266 | Tragic 6.2% |
| Spanish Americans | 0.2 /100 | #267 | Tragic 6.2% |
Demographics Similar to Russians by Married-Couple Family Poverty
In terms of married-couple family poverty, the demographic groups most similar to Russians are Immigrants from Lithuania (4.3%, a difference of 0.030%), Burmese (4.3%, a difference of 0.040%), Turkish (4.3%, a difference of 0.13%), Welsh (4.3%, a difference of 0.15%), and Australian (4.3%, a difference of 0.21%).
| Demographics | Rating | Rank | Married-Couple Family Poverty |
| Serbians | 99.8 /100 | #45 | Exceptional 4.3% |
| British | 99.8 /100 | #46 | Exceptional 4.3% |
| Immigrants | South Central Asia | 99.8 /100 | #47 | Exceptional 4.3% |
| Australians | 99.7 /100 | #48 | Exceptional 4.3% |
| Turks | 99.7 /100 | #49 | Exceptional 4.3% |
| Burmese | 99.7 /100 | #50 | Exceptional 4.3% |
| Immigrants | Lithuania | 99.7 /100 | #51 | Exceptional 4.3% |
| Russians | 99.7 /100 | #52 | Exceptional 4.3% |
| Welsh | 99.7 /100 | #53 | Exceptional 4.3% |
| Austrians | 99.7 /100 | #54 | Exceptional 4.3% |
| French | 99.7 /100 | #55 | Exceptional 4.3% |
| Immigrants | Zimbabwe | 99.7 /100 | #56 | Exceptional 4.3% |
| Immigrants | Netherlands | 99.7 /100 | #57 | Exceptional 4.3% |
| Czechoslovakians | 99.7 /100 | #58 | Exceptional 4.4% |
| Immigrants | Sweden | 99.6 /100 | #59 | Exceptional 4.4% |