Jamaican vs Tongan Average Family Size
COMPARE
Jamaican
Tongan
Average Family Size
Average Family Size Comparison
Jamaicans
Tongans
3.31
AVERAGE FAMILY SIZE
99.7/ 100
METRIC RATING
86th/ 347
METRIC RANK
3.49
AVERAGE FAMILY SIZE
100.0/ 100
METRIC RATING
15th/ 347
METRIC RANK
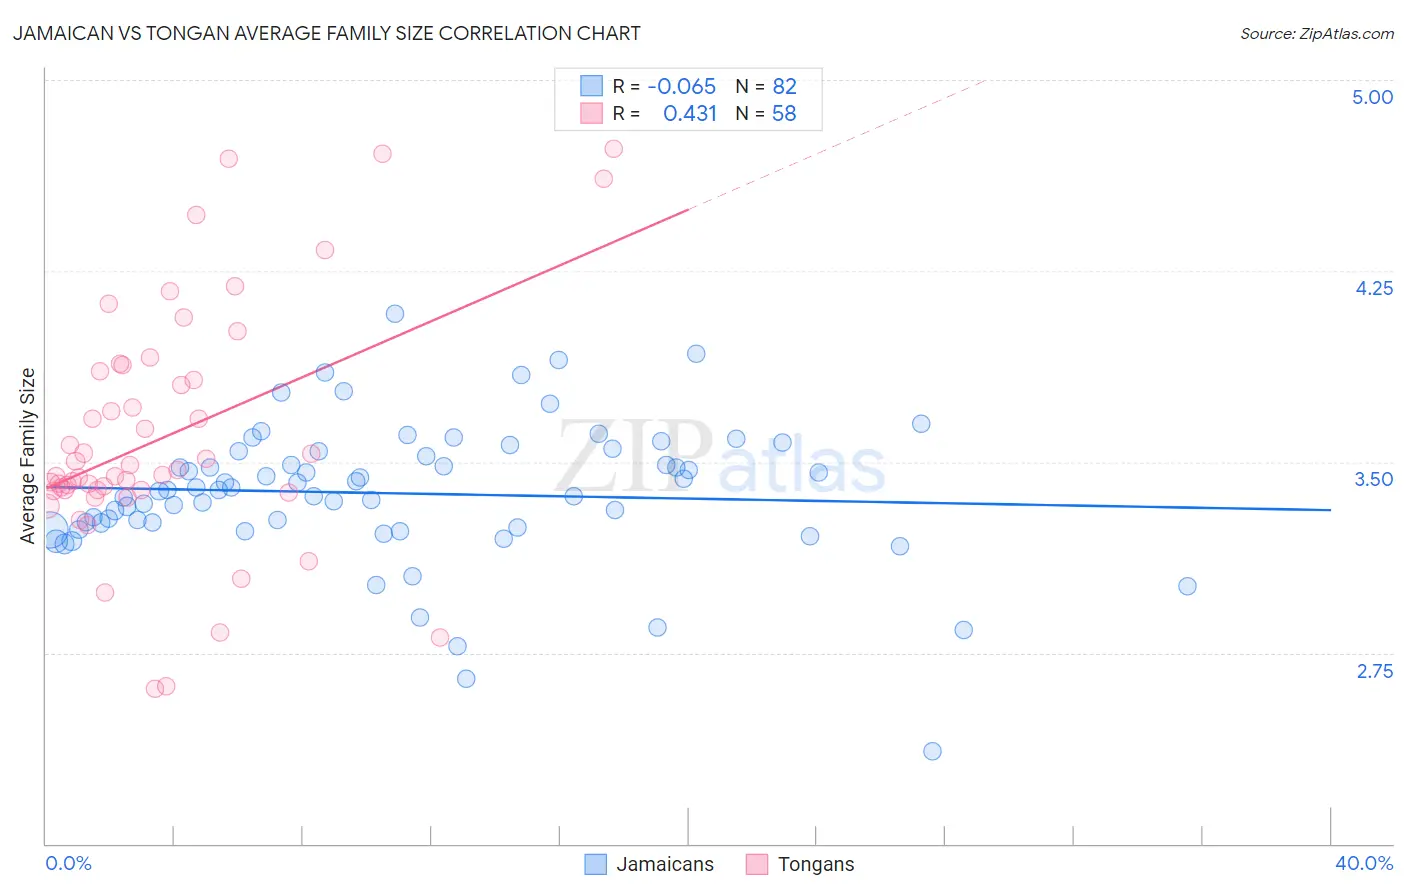
Jamaican vs Tongan Average Family Size Correlation Chart
The statistical analysis conducted on geographies consisting of 367,646,796 people shows a slight negative correlation between the proportion of Jamaicans and average family size in the United States with a correlation coefficient (R) of -0.065 and weighted average of 3.31. Similarly, the statistical analysis conducted on geographies consisting of 102,872,564 people shows a moderate positive correlation between the proportion of Tongans and average family size in the United States with a correlation coefficient (R) of 0.431 and weighted average of 3.49, a difference of 5.4%.
Average Family Size Correlation Summary
| Measurement | Jamaican | Tongan |
| Minimum | 2.36 | 2.61 |
| Maximum | 4.08 | 4.73 |
| Range | 1.72 | 2.12 |
| Mean | 3.38 | 3.60 |
| Median | 3.39 | 3.46 |
| Interquartile 25% (IQ1) | 3.24 | 3.39 |
| Interquartile 75% (IQ3) | 3.54 | 3.85 |
| Interquartile Range (IQR) | 0.30 | 0.47 |
| Standard Deviation (Sample) | 0.28 | 0.48 |
| Standard Deviation (Population) | 0.28 | 0.47 |
Similar Demographics by Average Family Size
Demographics Similar to Jamaicans by Average Family Size
In terms of average family size, the demographic groups most similar to Jamaicans are Afghan (3.31, a difference of 0.020%), Immigrants from Peru (3.31, a difference of 0.050%), Immigrants from Nigeria (3.32, a difference of 0.060%), Immigrants from Afghanistan (3.32, a difference of 0.10%), and Ecuadorian (3.32, a difference of 0.11%).
| Demographics | Rating | Rank | Average Family Size |
| British West Indians | 99.8 /100 | #79 | Exceptional 3.32 |
| Lumbee | 99.8 /100 | #80 | Exceptional 3.32 |
| Immigrants | Dominica | 99.8 /100 | #81 | Exceptional 3.32 |
| Ecuadorians | 99.8 /100 | #82 | Exceptional 3.32 |
| Immigrants | Afghanistan | 99.8 /100 | #83 | Exceptional 3.32 |
| Immigrants | Nigeria | 99.7 /100 | #84 | Exceptional 3.32 |
| Afghans | 99.7 /100 | #85 | Exceptional 3.31 |
| Jamaicans | 99.7 /100 | #86 | Exceptional 3.31 |
| Immigrants | Peru | 99.7 /100 | #87 | Exceptional 3.31 |
| Immigrants | Bolivia | 99.6 /100 | #88 | Exceptional 3.31 |
| Malaysians | 99.6 /100 | #89 | Exceptional 3.31 |
| Menominee | 99.4 /100 | #90 | Exceptional 3.30 |
| Immigrants | Pakistan | 99.2 /100 | #91 | Exceptional 3.30 |
| Immigrants | Cameroon | 99.2 /100 | #92 | Exceptional 3.30 |
| Peruvians | 99.2 /100 | #93 | Exceptional 3.30 |
Demographics Similar to Tongans by Average Family Size
In terms of average family size, the demographic groups most similar to Tongans are Immigrants from Central America (3.49, a difference of 0.050%), Ute (3.49, a difference of 0.060%), Immigrants from El Salvador (3.49, a difference of 0.15%), Salvadoran (3.48, a difference of 0.40%), and Mexican (3.48, a difference of 0.46%).
| Demographics | Rating | Rank | Average Family Size |
| Immigrants | Yemen | 100.0 /100 | #8 | Exceptional 3.60 |
| Hopi | 100.0 /100 | #9 | Exceptional 3.60 |
| Spanish American Indians | 100.0 /100 | #10 | Exceptional 3.58 |
| Tohono O'odham | 100.0 /100 | #11 | Exceptional 3.53 |
| Immigrants | Mexico | 100.0 /100 | #12 | Exceptional 3.52 |
| Sioux | 100.0 /100 | #13 | Exceptional 3.52 |
| Immigrants | Central America | 100.0 /100 | #14 | Exceptional 3.49 |
| Tongans | 100.0 /100 | #15 | Exceptional 3.49 |
| Ute | 100.0 /100 | #16 | Exceptional 3.49 |
| Immigrants | El Salvador | 100.0 /100 | #17 | Exceptional 3.49 |
| Salvadorans | 100.0 /100 | #18 | Exceptional 3.48 |
| Mexicans | 100.0 /100 | #19 | Exceptional 3.48 |
| Cheyenne | 100.0 /100 | #20 | Exceptional 3.47 |
| Yuman | 100.0 /100 | #21 | Exceptional 3.47 |
| Apache | 100.0 /100 | #22 | Exceptional 3.46 |