Iranian vs Scottish Female Poverty
COMPARE
Iranian
Scottish
Female Poverty
Female Poverty Comparison
Iranians
Scottish
11.7%
FEMALE POVERTY
99.6/ 100
METRIC RATING
27th/ 347
METRIC RANK
12.5%
FEMALE POVERTY
94.1/ 100
METRIC RATING
105th/ 347
METRIC RANK
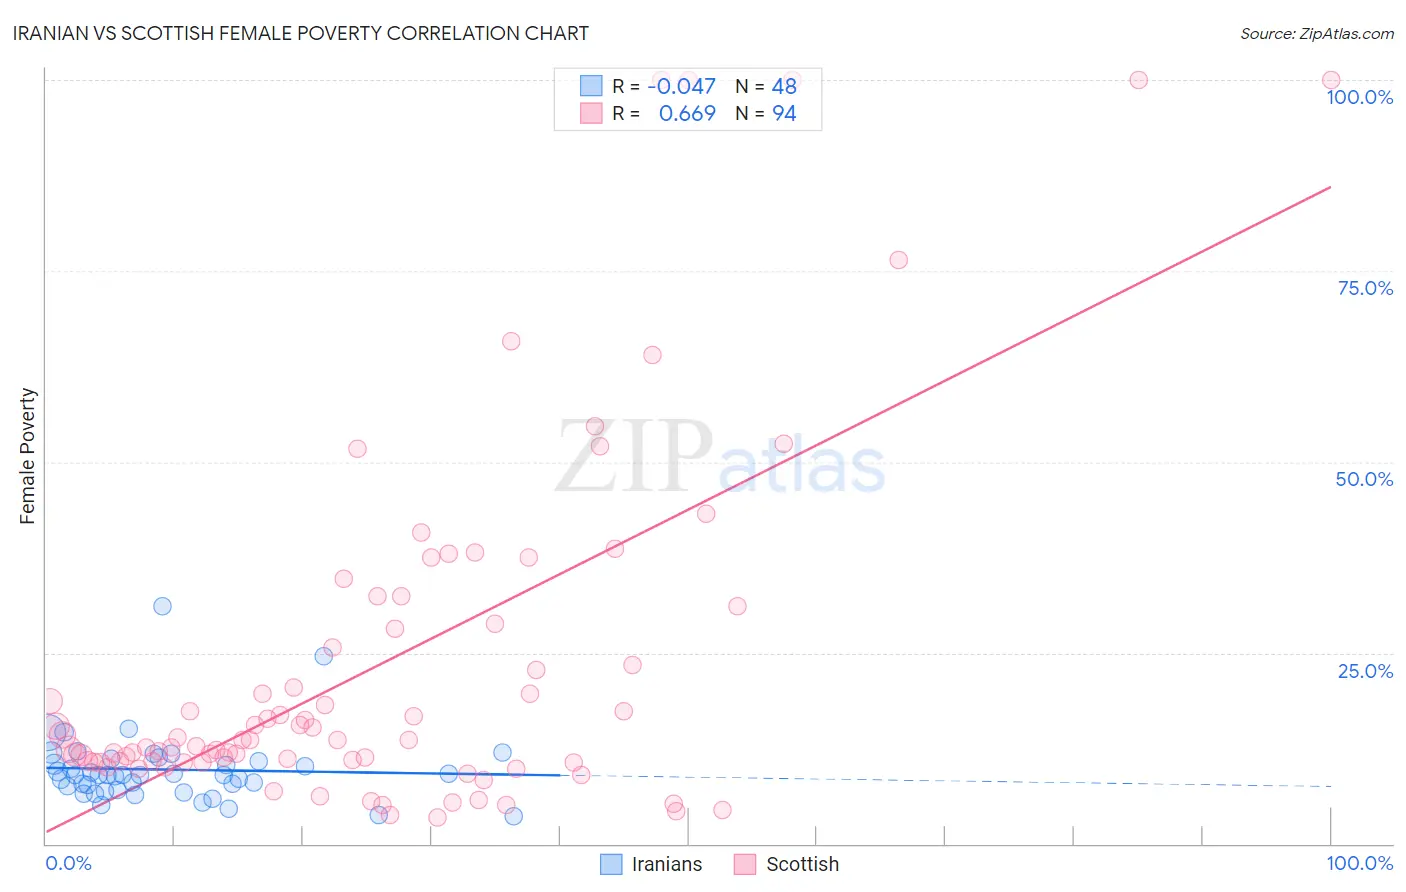
Iranian vs Scottish Female Poverty Correlation Chart
The statistical analysis conducted on geographies consisting of 316,618,692 people shows no correlation between the proportion of Iranians and poverty level among females in the United States with a correlation coefficient (R) of -0.047 and weighted average of 11.7%. Similarly, the statistical analysis conducted on geographies consisting of 565,877,668 people shows a significant positive correlation between the proportion of Scottish and poverty level among females in the United States with a correlation coefficient (R) of 0.669 and weighted average of 12.5%, a difference of 7.7%.
Female Poverty Correlation Summary
| Measurement | Iranian | Scottish |
| Minimum | 3.6% | 3.5% |
| Maximum | 31.0% | 100.0% |
| Range | 27.5% | 96.5% |
| Mean | 9.7% | 23.6% |
| Median | 9.0% | 13.6% |
| Interquartile 25% (IQ1) | 7.3% | 10.7% |
| Interquartile 75% (IQ3) | 11.0% | 28.8% |
| Interquartile Range (IQR) | 3.7% | 18.1% |
| Standard Deviation (Sample) | 4.7% | 23.5% |
| Standard Deviation (Population) | 4.6% | 23.4% |
Similar Demographics by Female Poverty
Demographics Similar to Iranians by Female Poverty
In terms of female poverty, the demographic groups most similar to Iranians are Immigrants from Northern Europe (11.6%, a difference of 0.11%), Croatian (11.6%, a difference of 0.11%), Immigrants from Korea (11.7%, a difference of 0.21%), Immigrants from North Macedonia (11.7%, a difference of 0.36%), and Luxembourger (11.6%, a difference of 0.38%).
| Demographics | Rating | Rank | Female Poverty |
| Eastern Europeans | 99.7 /100 | #20 | Exceptional 11.5% |
| Italians | 99.7 /100 | #21 | Exceptional 11.6% |
| Swedes | 99.7 /100 | #22 | Exceptional 11.6% |
| Burmese | 99.7 /100 | #23 | Exceptional 11.6% |
| Luxembourgers | 99.7 /100 | #24 | Exceptional 11.6% |
| Immigrants | Northern Europe | 99.6 /100 | #25 | Exceptional 11.6% |
| Croatians | 99.6 /100 | #26 | Exceptional 11.6% |
| Iranians | 99.6 /100 | #27 | Exceptional 11.7% |
| Immigrants | Korea | 99.6 /100 | #28 | Exceptional 11.7% |
| Immigrants | North Macedonia | 99.6 /100 | #29 | Exceptional 11.7% |
| Greeks | 99.5 /100 | #30 | Exceptional 11.7% |
| Poles | 99.5 /100 | #31 | Exceptional 11.7% |
| Danes | 99.5 /100 | #32 | Exceptional 11.7% |
| Cypriots | 99.5 /100 | #33 | Exceptional 11.8% |
| Immigrants | Singapore | 99.4 /100 | #34 | Exceptional 11.8% |
Demographics Similar to Scottish by Female Poverty
In terms of female poverty, the demographic groups most similar to Scottish are Palestinian (12.5%, a difference of 0.11%), Immigrants from Turkey (12.6%, a difference of 0.12%), Slavic (12.5%, a difference of 0.20%), Immigrants from China (12.5%, a difference of 0.22%), and Laotian (12.6%, a difference of 0.31%).
| Demographics | Rating | Rank | Female Poverty |
| Native Hawaiians | 95.1 /100 | #98 | Exceptional 12.5% |
| Romanians | 95.1 /100 | #99 | Exceptional 12.5% |
| Immigrants | Latvia | 94.8 /100 | #100 | Exceptional 12.5% |
| Tlingit-Haida | 94.8 /100 | #101 | Exceptional 12.5% |
| Immigrants | China | 94.5 /100 | #102 | Exceptional 12.5% |
| Slavs | 94.5 /100 | #103 | Exceptional 12.5% |
| Palestinians | 94.3 /100 | #104 | Exceptional 12.5% |
| Scottish | 94.1 /100 | #105 | Exceptional 12.5% |
| Immigrants | Turkey | 93.8 /100 | #106 | Exceptional 12.6% |
| Laotians | 93.4 /100 | #107 | Exceptional 12.6% |
| Portuguese | 93.1 /100 | #108 | Exceptional 12.6% |
| Immigrants | Zimbabwe | 93.1 /100 | #109 | Exceptional 12.6% |
| Paraguayans | 93.0 /100 | #110 | Exceptional 12.6% |
| Soviet Union | 92.4 /100 | #111 | Exceptional 12.6% |
| Immigrants | Israel | 92.0 /100 | #112 | Exceptional 12.6% |