Iranian vs Immigrants from Bolivia Female Poverty
COMPARE
Iranian
Immigrants from Bolivia
Female Poverty
Female Poverty Comparison
Iranians
Immigrants from Bolivia
11.7%
FEMALE POVERTY
99.6/ 100
METRIC RATING
27th/ 347
METRIC RANK
11.5%
FEMALE POVERTY
99.8/ 100
METRIC RATING
16th/ 347
METRIC RANK
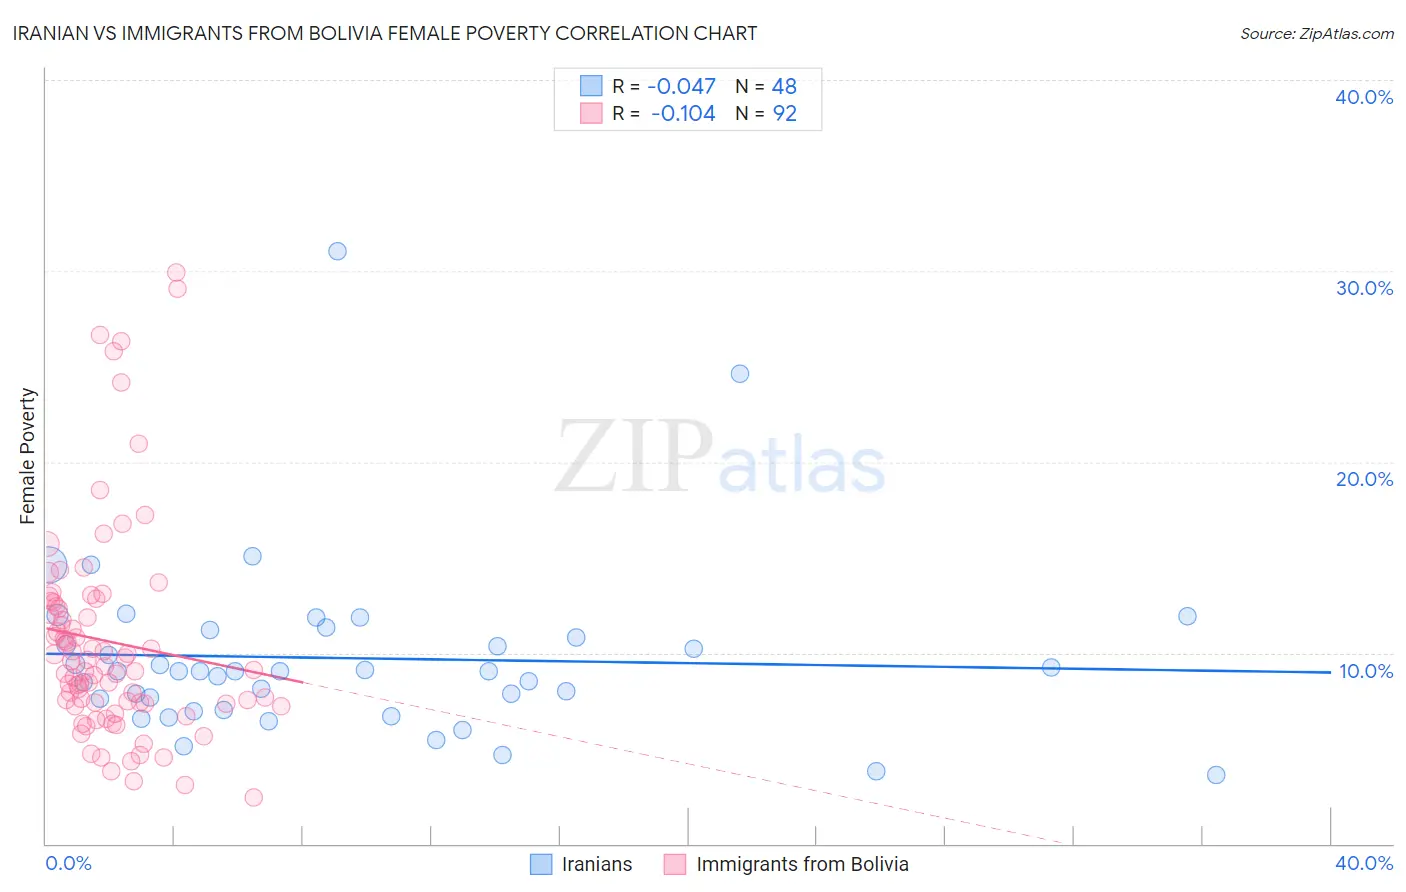
Iranian vs Immigrants from Bolivia Female Poverty Correlation Chart
The statistical analysis conducted on geographies consisting of 316,618,692 people shows no correlation between the proportion of Iranians and poverty level among females in the United States with a correlation coefficient (R) of -0.047 and weighted average of 11.7%. Similarly, the statistical analysis conducted on geographies consisting of 158,699,026 people shows a poor negative correlation between the proportion of Immigrants from Bolivia and poverty level among females in the United States with a correlation coefficient (R) of -0.104 and weighted average of 11.5%, a difference of 1.5%.
Female Poverty Correlation Summary
| Measurement | Iranian | Immigrants from Bolivia |
| Minimum | 3.6% | 2.4% |
| Maximum | 31.0% | 29.9% |
| Range | 27.5% | 27.5% |
| Mean | 9.7% | 10.6% |
| Median | 9.0% | 9.2% |
| Interquartile 25% (IQ1) | 7.3% | 7.3% |
| Interquartile 75% (IQ3) | 11.0% | 12.5% |
| Interquartile Range (IQR) | 3.7% | 5.2% |
| Standard Deviation (Sample) | 4.7% | 5.6% |
| Standard Deviation (Population) | 4.6% | 5.6% |
Demographics Similar to Iranians and Immigrants from Bolivia by Female Poverty
In terms of female poverty, the demographic groups most similar to Iranians are Immigrants from Northern Europe (11.6%, a difference of 0.11%), Croatian (11.6%, a difference of 0.11%), Immigrants from Korea (11.7%, a difference of 0.21%), Immigrants from North Macedonia (11.7%, a difference of 0.36%), and Luxembourger (11.6%, a difference of 0.38%). Similarly, the demographic groups most similar to Immigrants from Bolivia are Bolivian (11.5%, a difference of 0.070%), Immigrants from Scotland (11.5%, a difference of 0.12%), Norwegian (11.5%, a difference of 0.16%), Eastern European (11.5%, a difference of 0.39%), and Latvian (11.4%, a difference of 0.47%).
| Demographics | Rating | Rank | Female Poverty |
| Maltese | 99.9 /100 | #11 | Exceptional 11.2% |
| Bhutanese | 99.9 /100 | #12 | Exceptional 11.3% |
| Immigrants | Lithuania | 99.9 /100 | #13 | Exceptional 11.3% |
| Lithuanians | 99.8 /100 | #14 | Exceptional 11.4% |
| Latvians | 99.8 /100 | #15 | Exceptional 11.4% |
| Immigrants | Bolivia | 99.8 /100 | #16 | Exceptional 11.5% |
| Bolivians | 99.8 /100 | #17 | Exceptional 11.5% |
| Immigrants | Scotland | 99.8 /100 | #18 | Exceptional 11.5% |
| Norwegians | 99.8 /100 | #19 | Exceptional 11.5% |
| Eastern Europeans | 99.7 /100 | #20 | Exceptional 11.5% |
| Italians | 99.7 /100 | #21 | Exceptional 11.6% |
| Swedes | 99.7 /100 | #22 | Exceptional 11.6% |
| Burmese | 99.7 /100 | #23 | Exceptional 11.6% |
| Luxembourgers | 99.7 /100 | #24 | Exceptional 11.6% |
| Immigrants | Northern Europe | 99.6 /100 | #25 | Exceptional 11.6% |
| Croatians | 99.6 /100 | #26 | Exceptional 11.6% |
| Iranians | 99.6 /100 | #27 | Exceptional 11.7% |
| Immigrants | Korea | 99.6 /100 | #28 | Exceptional 11.7% |
| Immigrants | North Macedonia | 99.6 /100 | #29 | Exceptional 11.7% |
| Greeks | 99.5 /100 | #30 | Exceptional 11.7% |
| Poles | 99.5 /100 | #31 | Exceptional 11.7% |