Iranian vs Korean Female Poverty
COMPARE
Iranian
Korean
Female Poverty
Female Poverty Comparison
Iranians
Koreans
11.7%
FEMALE POVERTY
99.6/ 100
METRIC RATING
27th/ 347
METRIC RANK
11.9%
FEMALE POVERTY
99.2/ 100
METRIC RATING
43rd/ 347
METRIC RANK
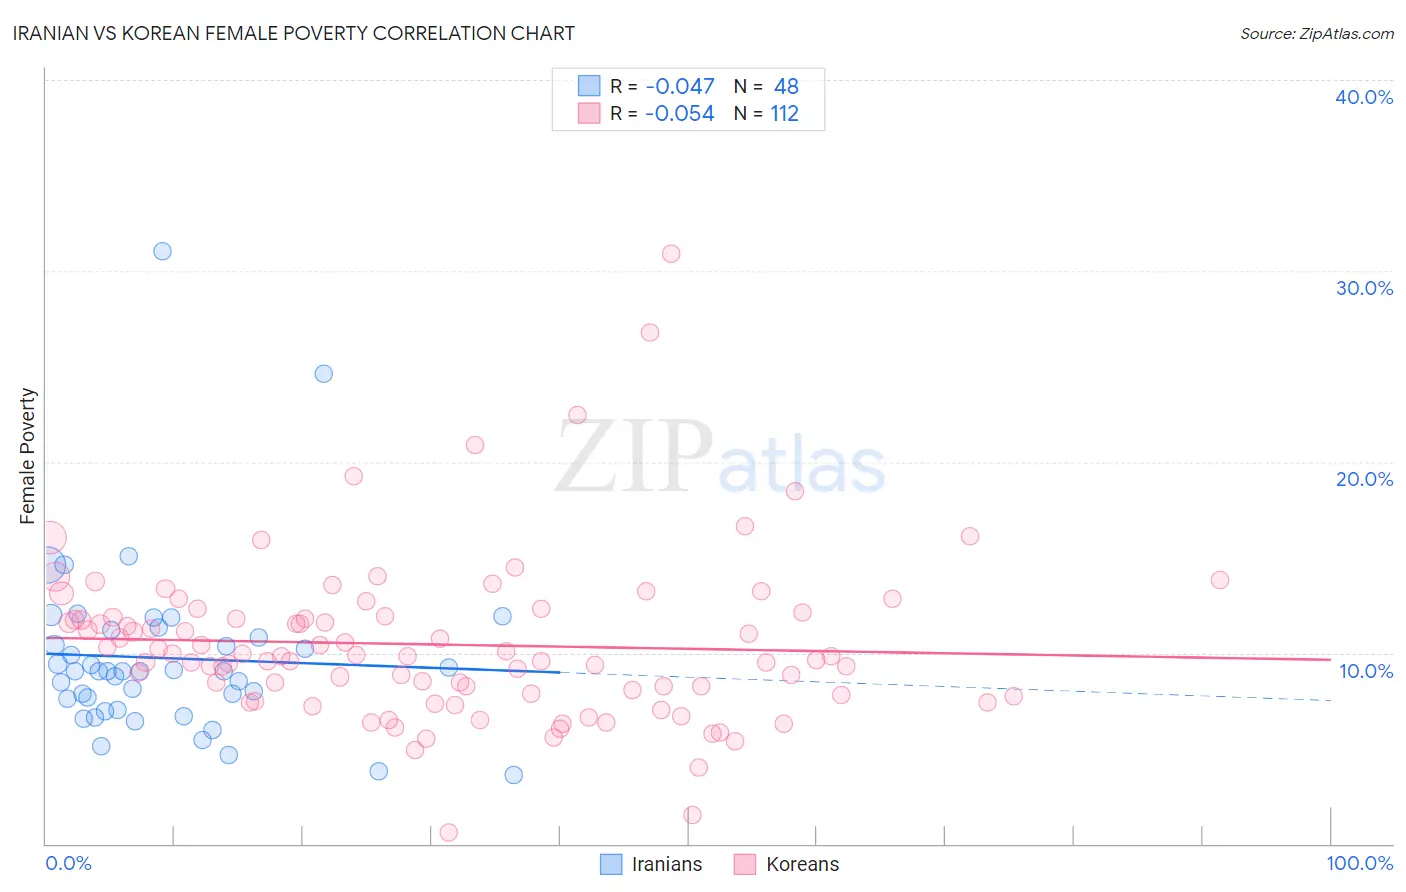
Iranian vs Korean Female Poverty Correlation Chart
The statistical analysis conducted on geographies consisting of 316,618,692 people shows no correlation between the proportion of Iranians and poverty level among females in the United States with a correlation coefficient (R) of -0.047 and weighted average of 11.7%. Similarly, the statistical analysis conducted on geographies consisting of 510,221,953 people shows a slight negative correlation between the proportion of Koreans and poverty level among females in the United States with a correlation coefficient (R) of -0.054 and weighted average of 11.9%, a difference of 1.9%.
Female Poverty Correlation Summary
| Measurement | Iranian | Korean |
| Minimum | 3.6% | 0.57% |
| Maximum | 31.0% | 30.9% |
| Range | 27.5% | 30.3% |
| Mean | 9.7% | 10.4% |
| Median | 9.0% | 9.8% |
| Interquartile 25% (IQ1) | 7.3% | 7.9% |
| Interquartile 75% (IQ3) | 11.0% | 11.9% |
| Interquartile Range (IQR) | 3.7% | 4.0% |
| Standard Deviation (Sample) | 4.7% | 4.3% |
| Standard Deviation (Population) | 4.6% | 4.3% |
Demographics Similar to Iranians and Koreans by Female Poverty
In terms of female poverty, the demographic groups most similar to Iranians are Immigrants from Northern Europe (11.6%, a difference of 0.11%), Croatian (11.6%, a difference of 0.11%), Immigrants from Korea (11.7%, a difference of 0.21%), Immigrants from North Macedonia (11.7%, a difference of 0.36%), and Greek (11.7%, a difference of 0.44%). Similarly, the demographic groups most similar to Koreans are Czech (11.9%, a difference of 0.040%), Immigrants from Moldova (11.9%, a difference of 0.040%), Tongan (11.9%, a difference of 0.070%), Immigrants from Czechoslovakia (11.9%, a difference of 0.16%), and Macedonian (11.8%, a difference of 0.22%).
| Demographics | Rating | Rank | Female Poverty |
| Immigrants | Northern Europe | 99.6 /100 | #25 | Exceptional 11.6% |
| Croatians | 99.6 /100 | #26 | Exceptional 11.6% |
| Iranians | 99.6 /100 | #27 | Exceptional 11.7% |
| Immigrants | Korea | 99.6 /100 | #28 | Exceptional 11.7% |
| Immigrants | North Macedonia | 99.6 /100 | #29 | Exceptional 11.7% |
| Greeks | 99.5 /100 | #30 | Exceptional 11.7% |
| Poles | 99.5 /100 | #31 | Exceptional 11.7% |
| Danes | 99.5 /100 | #32 | Exceptional 11.7% |
| Cypriots | 99.5 /100 | #33 | Exceptional 11.8% |
| Immigrants | Singapore | 99.4 /100 | #34 | Exceptional 11.8% |
| Immigrants | Iran | 99.4 /100 | #35 | Exceptional 11.8% |
| Immigrants | Pakistan | 99.4 /100 | #36 | Exceptional 11.8% |
| Immigrants | Greece | 99.3 /100 | #37 | Exceptional 11.8% |
| Russians | 99.3 /100 | #38 | Exceptional 11.8% |
| Immigrants | Poland | 99.3 /100 | #39 | Exceptional 11.8% |
| Macedonians | 99.3 /100 | #40 | Exceptional 11.8% |
| Czechs | 99.2 /100 | #41 | Exceptional 11.9% |
| Immigrants | Moldova | 99.2 /100 | #42 | Exceptional 11.9% |
| Koreans | 99.2 /100 | #43 | Exceptional 11.9% |
| Tongans | 99.2 /100 | #44 | Exceptional 11.9% |
| Immigrants | Czechoslovakia | 99.2 /100 | #45 | Exceptional 11.9% |