Iranian vs Scottish Unemployment Among Ages 30 to 34 years
COMPARE
Iranian
Scottish
Unemployment Among Ages 30 to 34 years
Unemployment Among Ages 30 to 34 years Comparison
Iranians
Scottish
5.2%
UNEMPLOYMENT AMONG AGES 30 TO 34 YEARS
96.0/ 100
METRIC RATING
75th/ 347
METRIC RANK
5.5%
UNEMPLOYMENT AMONG AGES 30 TO 34 YEARS
51.8/ 100
METRIC RATING
171st/ 347
METRIC RANK
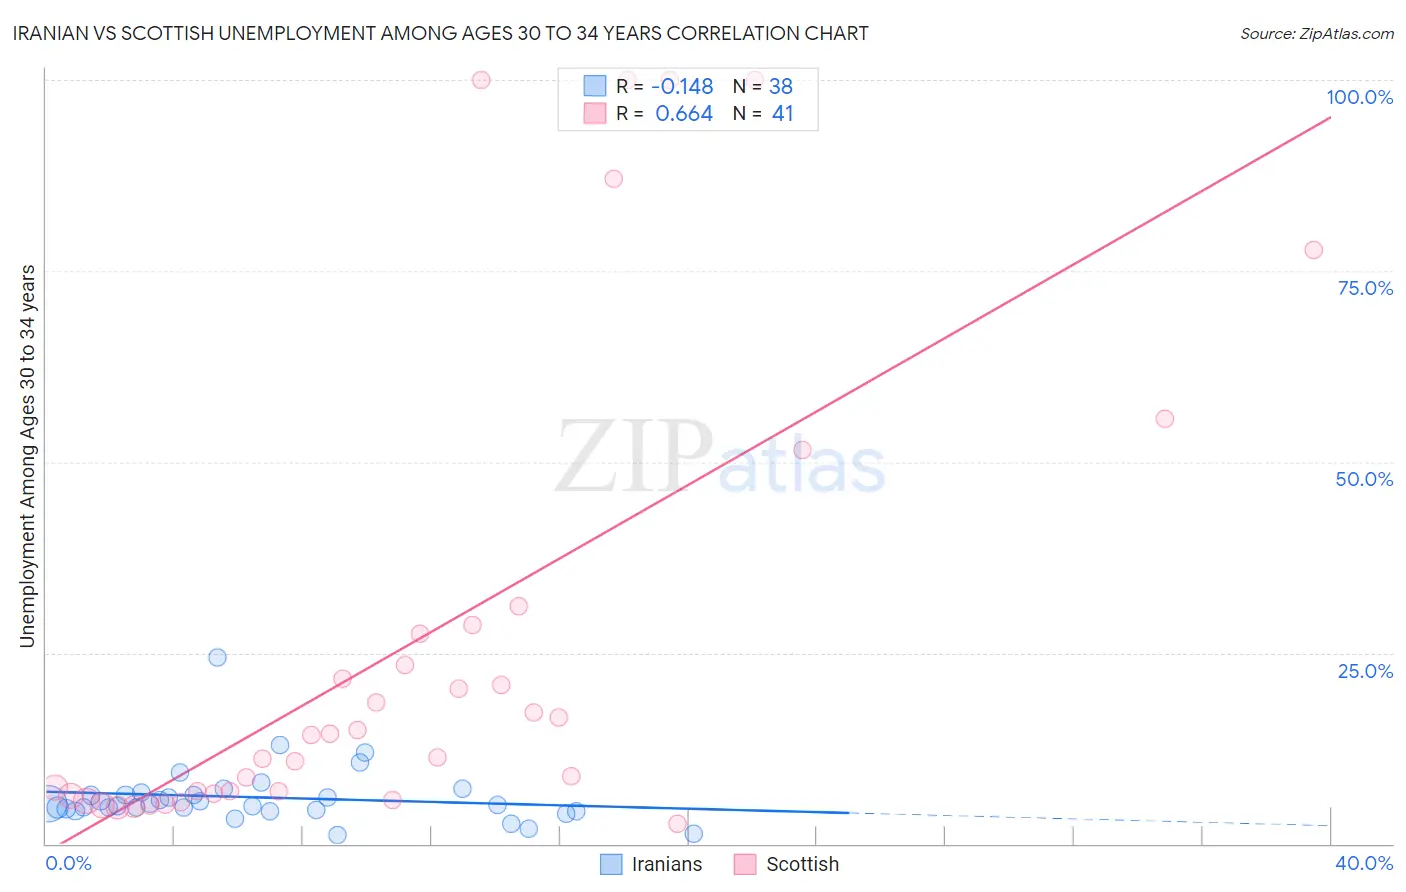
Iranian vs Scottish Unemployment Among Ages 30 to 34 years Correlation Chart
The statistical analysis conducted on geographies consisting of 304,439,864 people shows a poor negative correlation between the proportion of Iranians and unemployment rate among population between the ages 30 and 34 in the United States with a correlation coefficient (R) of -0.148 and weighted average of 5.2%. Similarly, the statistical analysis conducted on geographies consisting of 494,408,202 people shows a significant positive correlation between the proportion of Scottish and unemployment rate among population between the ages 30 and 34 in the United States with a correlation coefficient (R) of 0.664 and weighted average of 5.5%, a difference of 5.7%.
Unemployment Among Ages 30 to 34 years Correlation Summary
| Measurement | Iranian | Scottish |
| Minimum | 1.1% | 2.7% |
| Maximum | 24.4% | 100.0% |
| Range | 23.3% | 97.3% |
| Mean | 6.1% | 26.3% |
| Median | 5.1% | 14.3% |
| Interquartile 25% (IQ1) | 4.5% | 6.4% |
| Interquartile 75% (IQ3) | 6.4% | 28.0% |
| Interquartile Range (IQR) | 1.9% | 21.6% |
| Standard Deviation (Sample) | 3.9% | 30.8% |
| Standard Deviation (Population) | 3.9% | 30.5% |
Similar Demographics by Unemployment Among Ages 30 to 34 years
Demographics Similar to Iranians by Unemployment Among Ages 30 to 34 years
In terms of unemployment among ages 30 to 34 years, the demographic groups most similar to Iranians are Immigrants from Asia (5.2%, a difference of 0.060%), Slovene (5.2%, a difference of 0.090%), Immigrants from Moldova (5.1%, a difference of 0.18%), Immigrants from Northern Africa (5.1%, a difference of 0.20%), and Immigrants from Iraq (5.1%, a difference of 0.20%).
| Demographics | Rating | Rank | Unemployment Among Ages 30 to 34 years |
| Jordanians | 96.5 /100 | #68 | Exceptional 5.1% |
| Immigrants | Northern Africa | 96.4 /100 | #69 | Exceptional 5.1% |
| Immigrants | Iraq | 96.4 /100 | #70 | Exceptional 5.1% |
| Paraguayans | 96.4 /100 | #71 | Exceptional 5.1% |
| Immigrants | Moldova | 96.4 /100 | #72 | Exceptional 5.1% |
| Slovenes | 96.2 /100 | #73 | Exceptional 5.2% |
| Immigrants | Asia | 96.2 /100 | #74 | Exceptional 5.2% |
| Iranians | 96.0 /100 | #75 | Exceptional 5.2% |
| Scandinavians | 95.6 /100 | #76 | Exceptional 5.2% |
| Uruguayans | 95.4 /100 | #77 | Exceptional 5.2% |
| Indonesians | 95.1 /100 | #78 | Exceptional 5.2% |
| Immigrants | Lithuania | 95.0 /100 | #79 | Exceptional 5.2% |
| Immigrants | Indonesia | 94.7 /100 | #80 | Exceptional 5.2% |
| Chileans | 94.4 /100 | #81 | Exceptional 5.2% |
| Immigrants | Latvia | 94.2 /100 | #82 | Exceptional 5.2% |
Demographics Similar to Scottish by Unemployment Among Ages 30 to 34 years
In terms of unemployment among ages 30 to 34 years, the demographic groups most similar to Scottish are Immigrants from Austria (5.5%, a difference of 0.030%), Dutch (5.5%, a difference of 0.060%), Immigrants from Israel (5.4%, a difference of 0.070%), South American (5.4%, a difference of 0.080%), and Peruvian (5.5%, a difference of 0.11%).
| Demographics | Rating | Rank | Unemployment Among Ages 30 to 34 years |
| Basques | 57.3 /100 | #164 | Average 5.4% |
| Welsh | 56.3 /100 | #165 | Average 5.4% |
| Immigrants | Thailand | 55.6 /100 | #166 | Average 5.4% |
| English | 54.8 /100 | #167 | Average 5.4% |
| South Americans | 52.9 /100 | #168 | Average 5.4% |
| Immigrants | Israel | 52.9 /100 | #169 | Average 5.4% |
| Dutch | 52.6 /100 | #170 | Average 5.5% |
| Scottish | 51.8 /100 | #171 | Average 5.5% |
| Immigrants | Austria | 51.3 /100 | #172 | Average 5.5% |
| Peruvians | 50.2 /100 | #173 | Average 5.5% |
| Immigrants | Laos | 50.0 /100 | #174 | Average 5.5% |
| Afghans | 49.6 /100 | #175 | Average 5.5% |
| Immigrants | Peru | 48.0 /100 | #176 | Average 5.5% |
| Immigrants | Ukraine | 47.7 /100 | #177 | Average 5.5% |
| Macedonians | 47.1 /100 | #178 | Average 5.5% |