Iranian vs West Indian Female Poverty
COMPARE
Iranian
West Indian
Female Poverty
Female Poverty Comparison
Iranians
West Indians
11.7%
FEMALE POVERTY
99.6/ 100
METRIC RATING
27th/ 347
METRIC RANK
16.1%
FEMALE POVERTY
0.0/ 100
METRIC RATING
281st/ 347
METRIC RANK
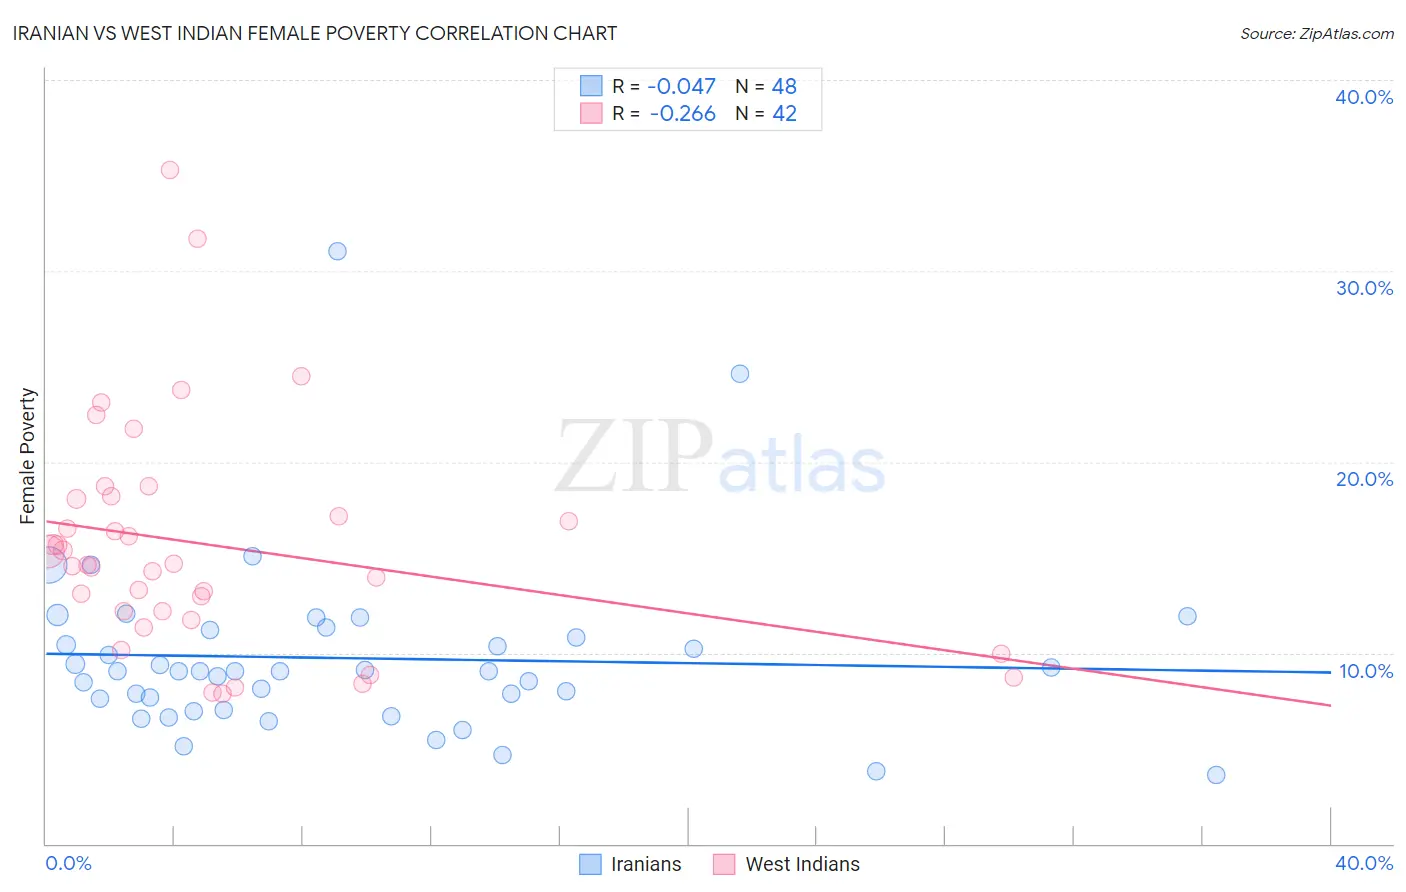
Iranian vs West Indian Female Poverty Correlation Chart
The statistical analysis conducted on geographies consisting of 316,618,692 people shows no correlation between the proportion of Iranians and poverty level among females in the United States with a correlation coefficient (R) of -0.047 and weighted average of 11.7%. Similarly, the statistical analysis conducted on geographies consisting of 253,850,168 people shows a weak negative correlation between the proportion of West Indians and poverty level among females in the United States with a correlation coefficient (R) of -0.266 and weighted average of 16.1%, a difference of 38.3%.
Female Poverty Correlation Summary
| Measurement | Iranian | West Indian |
| Minimum | 3.6% | 7.8% |
| Maximum | 31.0% | 35.3% |
| Range | 27.5% | 27.4% |
| Mean | 9.7% | 15.7% |
| Median | 9.0% | 14.6% |
| Interquartile 25% (IQ1) | 7.3% | 12.2% |
| Interquartile 75% (IQ3) | 11.0% | 18.1% |
| Interquartile Range (IQR) | 3.7% | 5.9% |
| Standard Deviation (Sample) | 4.7% | 5.9% |
| Standard Deviation (Population) | 4.6% | 5.9% |
Similar Demographics by Female Poverty
Demographics Similar to Iranians by Female Poverty
In terms of female poverty, the demographic groups most similar to Iranians are Immigrants from Northern Europe (11.6%, a difference of 0.11%), Croatian (11.6%, a difference of 0.11%), Immigrants from Korea (11.7%, a difference of 0.21%), Immigrants from North Macedonia (11.7%, a difference of 0.36%), and Luxembourger (11.6%, a difference of 0.38%).
| Demographics | Rating | Rank | Female Poverty |
| Eastern Europeans | 99.7 /100 | #20 | Exceptional 11.5% |
| Italians | 99.7 /100 | #21 | Exceptional 11.6% |
| Swedes | 99.7 /100 | #22 | Exceptional 11.6% |
| Burmese | 99.7 /100 | #23 | Exceptional 11.6% |
| Luxembourgers | 99.7 /100 | #24 | Exceptional 11.6% |
| Immigrants | Northern Europe | 99.6 /100 | #25 | Exceptional 11.6% |
| Croatians | 99.6 /100 | #26 | Exceptional 11.6% |
| Iranians | 99.6 /100 | #27 | Exceptional 11.7% |
| Immigrants | Korea | 99.6 /100 | #28 | Exceptional 11.7% |
| Immigrants | North Macedonia | 99.6 /100 | #29 | Exceptional 11.7% |
| Greeks | 99.5 /100 | #30 | Exceptional 11.7% |
| Poles | 99.5 /100 | #31 | Exceptional 11.7% |
| Danes | 99.5 /100 | #32 | Exceptional 11.7% |
| Cypriots | 99.5 /100 | #33 | Exceptional 11.8% |
| Immigrants | Singapore | 99.4 /100 | #34 | Exceptional 11.8% |
Demographics Similar to West Indians by Female Poverty
In terms of female poverty, the demographic groups most similar to West Indians are Vietnamese (16.1%, a difference of 0.020%), Immigrants from Haiti (16.1%, a difference of 0.15%), Immigrants from Cuba (16.1%, a difference of 0.24%), Immigrants from Bahamas (16.1%, a difference of 0.26%), and Spanish American (16.2%, a difference of 0.29%).
| Demographics | Rating | Rank | Female Poverty |
| Barbadians | 0.0 /100 | #274 | Tragic 15.9% |
| Immigrants | Barbados | 0.0 /100 | #275 | Tragic 16.0% |
| Central Americans | 0.0 /100 | #276 | Tragic 16.0% |
| Bangladeshis | 0.0 /100 | #277 | Tragic 16.0% |
| Immigrants | West Indies | 0.0 /100 | #278 | Tragic 16.1% |
| Immigrants | Bahamas | 0.0 /100 | #279 | Tragic 16.1% |
| Vietnamese | 0.0 /100 | #280 | Tragic 16.1% |
| West Indians | 0.0 /100 | #281 | Tragic 16.1% |
| Immigrants | Haiti | 0.0 /100 | #282 | Tragic 16.1% |
| Immigrants | Cuba | 0.0 /100 | #283 | Tragic 16.1% |
| Spanish Americans | 0.0 /100 | #284 | Tragic 16.2% |
| Comanche | 0.0 /100 | #285 | Tragic 16.2% |
| Inupiat | 0.0 /100 | #286 | Tragic 16.2% |
| Immigrants | Belize | 0.0 /100 | #287 | Tragic 16.3% |
| Indonesians | 0.0 /100 | #288 | Tragic 16.4% |