Spanish American Indian vs Scottish Female Poverty
COMPARE
Spanish American Indian
Scottish
Female Poverty
Female Poverty Comparison
Spanish American Indians
Scottish
15.3%
FEMALE POVERTY
0.3/ 100
METRIC RATING
245th/ 347
METRIC RANK
12.5%
FEMALE POVERTY
94.1/ 100
METRIC RATING
105th/ 347
METRIC RANK
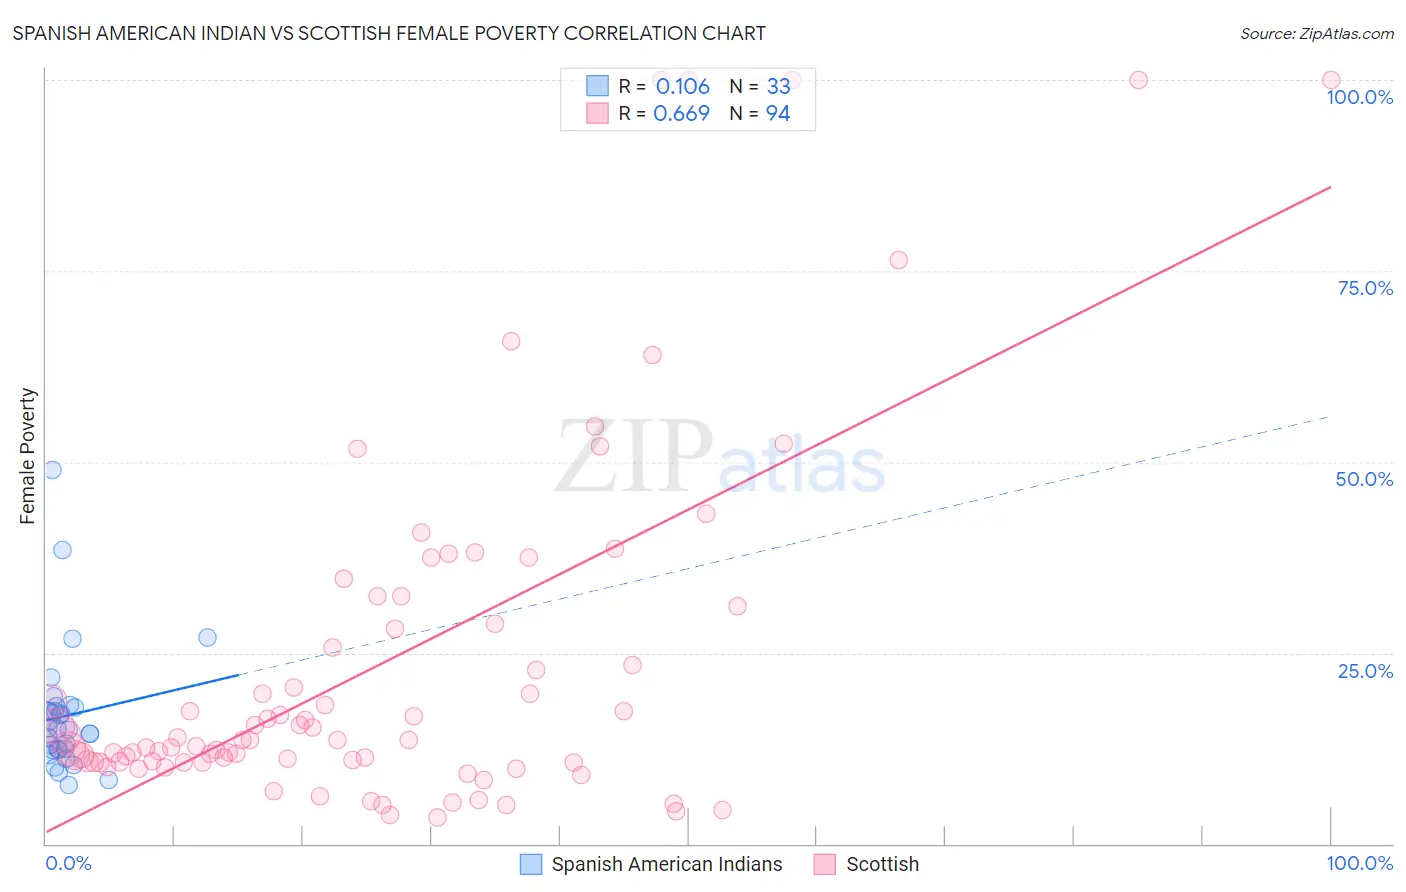
Spanish American Indian vs Scottish Female Poverty Correlation Chart
The statistical analysis conducted on geographies consisting of 73,136,112 people shows a poor positive correlation between the proportion of Spanish American Indians and poverty level among females in the United States with a correlation coefficient (R) of 0.106 and weighted average of 15.3%. Similarly, the statistical analysis conducted on geographies consisting of 565,877,668 people shows a significant positive correlation between the proportion of Scottish and poverty level among females in the United States with a correlation coefficient (R) of 0.669 and weighted average of 12.5%, a difference of 21.9%.
Female Poverty Correlation Summary
| Measurement | Spanish American Indian | Scottish |
| Minimum | 7.6% | 3.5% |
| Maximum | 48.9% | 100.0% |
| Range | 41.2% | 96.5% |
| Mean | 16.8% | 23.6% |
| Median | 15.0% | 13.6% |
| Interquartile 25% (IQ1) | 12.3% | 10.7% |
| Interquartile 75% (IQ3) | 17.9% | 28.8% |
| Interquartile Range (IQR) | 5.6% | 18.1% |
| Standard Deviation (Sample) | 8.3% | 23.5% |
| Standard Deviation (Population) | 8.2% | 23.4% |
Similar Demographics by Female Poverty
Demographics Similar to Spanish American Indians by Female Poverty
In terms of female poverty, the demographic groups most similar to Spanish American Indians are Cuban (15.3%, a difference of 0.050%), Potawatomi (15.3%, a difference of 0.060%), Immigrants from Ghana (15.3%, a difference of 0.060%), Ecuadorian (15.3%, a difference of 0.090%), and Nicaraguan (15.3%, a difference of 0.15%).
| Demographics | Rating | Rank | Female Poverty |
| Immigrants | Armenia | 0.6 /100 | #238 | Tragic 15.1% |
| Immigrants | Middle Africa | 0.5 /100 | #239 | Tragic 15.2% |
| Sudanese | 0.5 /100 | #240 | Tragic 15.2% |
| Immigrants | Sudan | 0.4 /100 | #241 | Tragic 15.2% |
| Nepalese | 0.4 /100 | #242 | Tragic 15.2% |
| Nicaraguans | 0.3 /100 | #243 | Tragic 15.3% |
| Ecuadorians | 0.3 /100 | #244 | Tragic 15.3% |
| Spanish American Indians | 0.3 /100 | #245 | Tragic 15.3% |
| Cubans | 0.3 /100 | #246 | Tragic 15.3% |
| Potawatomi | 0.3 /100 | #247 | Tragic 15.3% |
| Immigrants | Ghana | 0.3 /100 | #248 | Tragic 15.3% |
| Salvadorans | 0.3 /100 | #249 | Tragic 15.3% |
| Immigrants | Western Africa | 0.3 /100 | #250 | Tragic 15.3% |
| Immigrants | Trinidad and Tobago | 0.3 /100 | #251 | Tragic 15.4% |
| Immigrants | Burma/Myanmar | 0.3 /100 | #252 | Tragic 15.4% |
Demographics Similar to Scottish by Female Poverty
In terms of female poverty, the demographic groups most similar to Scottish are Palestinian (12.5%, a difference of 0.11%), Immigrants from Turkey (12.6%, a difference of 0.12%), Slavic (12.5%, a difference of 0.20%), Immigrants from China (12.5%, a difference of 0.22%), and Laotian (12.6%, a difference of 0.31%).
| Demographics | Rating | Rank | Female Poverty |
| Native Hawaiians | 95.1 /100 | #98 | Exceptional 12.5% |
| Romanians | 95.1 /100 | #99 | Exceptional 12.5% |
| Immigrants | Latvia | 94.8 /100 | #100 | Exceptional 12.5% |
| Tlingit-Haida | 94.8 /100 | #101 | Exceptional 12.5% |
| Immigrants | China | 94.5 /100 | #102 | Exceptional 12.5% |
| Slavs | 94.5 /100 | #103 | Exceptional 12.5% |
| Palestinians | 94.3 /100 | #104 | Exceptional 12.5% |
| Scottish | 94.1 /100 | #105 | Exceptional 12.5% |
| Immigrants | Turkey | 93.8 /100 | #106 | Exceptional 12.6% |
| Laotians | 93.4 /100 | #107 | Exceptional 12.6% |
| Portuguese | 93.1 /100 | #108 | Exceptional 12.6% |
| Immigrants | Zimbabwe | 93.1 /100 | #109 | Exceptional 12.6% |
| Paraguayans | 93.0 /100 | #110 | Exceptional 12.6% |
| Soviet Union | 92.4 /100 | #111 | Exceptional 12.6% |
| Immigrants | Israel | 92.0 /100 | #112 | Exceptional 12.6% |