Immigrants from Fiji vs Scottish Female Poverty
COMPARE
Immigrants from Fiji
Scottish
Female Poverty
Female Poverty Comparison
Immigrants from Fiji
Scottish
13.2%
FEMALE POVERTY
71.0/ 100
METRIC RATING
153rd/ 347
METRIC RANK
12.5%
FEMALE POVERTY
94.1/ 100
METRIC RATING
105th/ 347
METRIC RANK
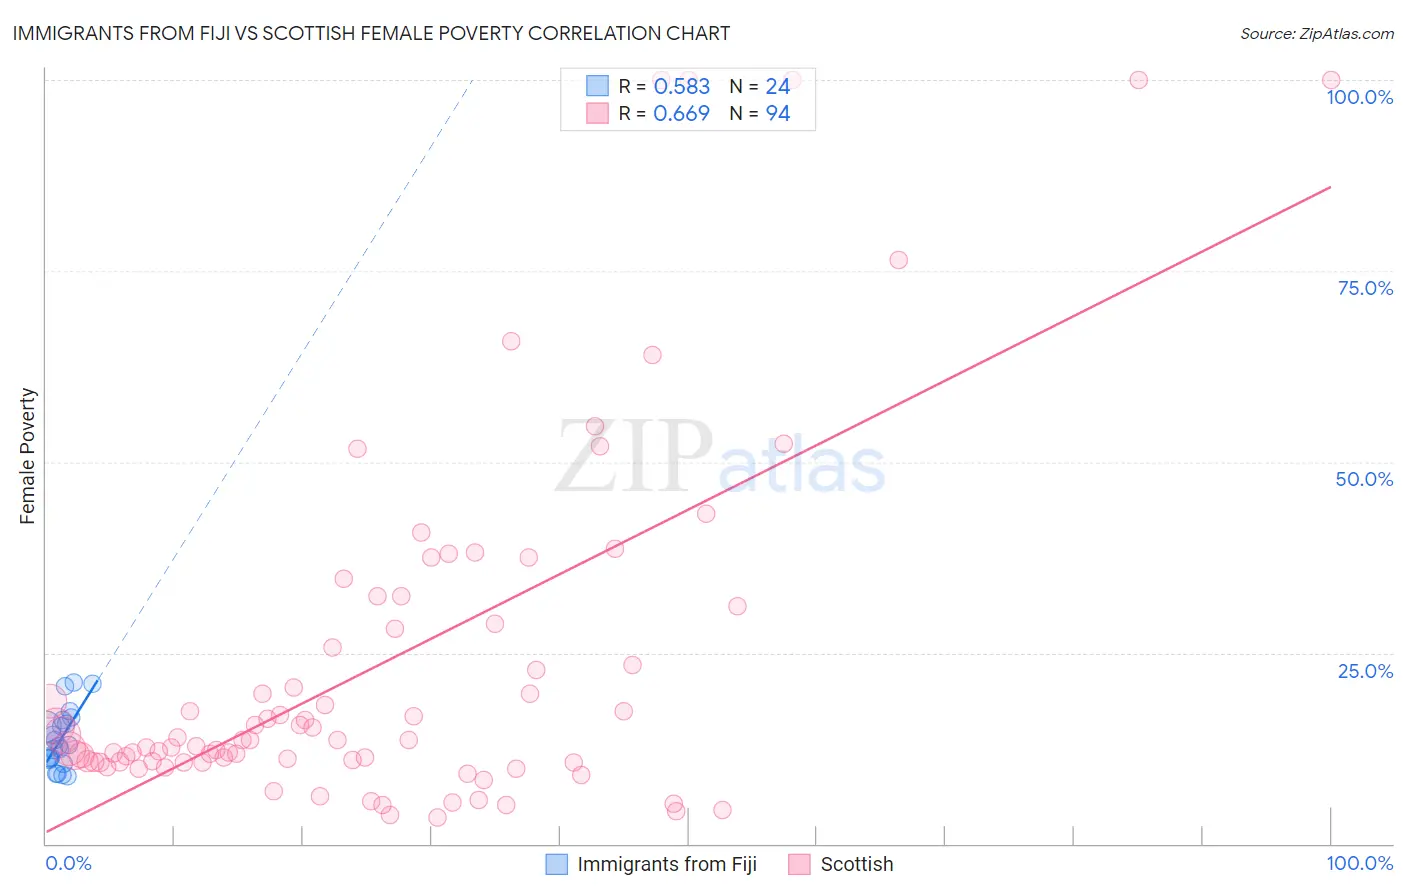
Immigrants from Fiji vs Scottish Female Poverty Correlation Chart
The statistical analysis conducted on geographies consisting of 93,754,712 people shows a substantial positive correlation between the proportion of Immigrants from Fiji and poverty level among females in the United States with a correlation coefficient (R) of 0.583 and weighted average of 13.2%. Similarly, the statistical analysis conducted on geographies consisting of 565,877,668 people shows a significant positive correlation between the proportion of Scottish and poverty level among females in the United States with a correlation coefficient (R) of 0.669 and weighted average of 12.5%, a difference of 4.8%.
Female Poverty Correlation Summary
| Measurement | Immigrants from Fiji | Scottish |
| Minimum | 8.9% | 3.5% |
| Maximum | 21.1% | 100.0% |
| Range | 12.2% | 96.5% |
| Mean | 13.7% | 23.6% |
| Median | 12.9% | 13.6% |
| Interquartile 25% (IQ1) | 11.2% | 10.7% |
| Interquartile 75% (IQ3) | 16.0% | 28.8% |
| Interquartile Range (IQR) | 4.8% | 18.1% |
| Standard Deviation (Sample) | 3.7% | 23.5% |
| Standard Deviation (Population) | 3.7% | 23.4% |
Similar Demographics by Female Poverty
Demographics Similar to Immigrants from Fiji by Female Poverty
In terms of female poverty, the demographic groups most similar to Immigrants from Fiji are Armenian (13.2%, a difference of 0.070%), Hungarian (13.2%, a difference of 0.10%), Immigrants from Bosnia and Herzegovina (13.2%, a difference of 0.15%), Immigrants from Northern Africa (13.2%, a difference of 0.25%), and Samoan (13.1%, a difference of 0.32%).
| Demographics | Rating | Rank | Female Poverty |
| Immigrants | Peru | 79.1 /100 | #146 | Good 13.0% |
| Immigrants | Kazakhstan | 78.6 /100 | #147 | Good 13.0% |
| Yugoslavians | 76.9 /100 | #148 | Good 13.1% |
| Taiwanese | 75.7 /100 | #149 | Good 13.1% |
| Tsimshian | 75.5 /100 | #150 | Good 13.1% |
| Immigrants | Germany | 74.9 /100 | #151 | Good 13.1% |
| Samoans | 73.6 /100 | #152 | Good 13.1% |
| Immigrants | Fiji | 71.0 /100 | #153 | Good 13.2% |
| Armenians | 70.4 /100 | #154 | Good 13.2% |
| Hungarians | 70.1 /100 | #155 | Good 13.2% |
| Immigrants | Bosnia and Herzegovina | 69.7 /100 | #156 | Good 13.2% |
| Immigrants | Northern Africa | 68.8 /100 | #157 | Good 13.2% |
| Pennsylvania Germans | 67.3 /100 | #158 | Good 13.2% |
| Costa Ricans | 63.6 /100 | #159 | Good 13.3% |
| Immigrants | Nepal | 62.7 /100 | #160 | Good 13.3% |
Demographics Similar to Scottish by Female Poverty
In terms of female poverty, the demographic groups most similar to Scottish are Palestinian (12.5%, a difference of 0.11%), Immigrants from Turkey (12.6%, a difference of 0.12%), Slavic (12.5%, a difference of 0.20%), Immigrants from China (12.5%, a difference of 0.22%), and Laotian (12.6%, a difference of 0.31%).
| Demographics | Rating | Rank | Female Poverty |
| Native Hawaiians | 95.1 /100 | #98 | Exceptional 12.5% |
| Romanians | 95.1 /100 | #99 | Exceptional 12.5% |
| Immigrants | Latvia | 94.8 /100 | #100 | Exceptional 12.5% |
| Tlingit-Haida | 94.8 /100 | #101 | Exceptional 12.5% |
| Immigrants | China | 94.5 /100 | #102 | Exceptional 12.5% |
| Slavs | 94.5 /100 | #103 | Exceptional 12.5% |
| Palestinians | 94.3 /100 | #104 | Exceptional 12.5% |
| Scottish | 94.1 /100 | #105 | Exceptional 12.5% |
| Immigrants | Turkey | 93.8 /100 | #106 | Exceptional 12.6% |
| Laotians | 93.4 /100 | #107 | Exceptional 12.6% |
| Portuguese | 93.1 /100 | #108 | Exceptional 12.6% |
| Immigrants | Zimbabwe | 93.1 /100 | #109 | Exceptional 12.6% |
| Paraguayans | 93.0 /100 | #110 | Exceptional 12.6% |
| Soviet Union | 92.4 /100 | #111 | Exceptional 12.6% |
| Immigrants | Israel | 92.0 /100 | #112 | Exceptional 12.6% |