Immigrants from Norway vs Scottish Female Poverty
COMPARE
Immigrants from Norway
Scottish
Female Poverty
Female Poverty Comparison
Immigrants from Norway
Scottish
12.8%
FEMALE POVERTY
89.3/ 100
METRIC RATING
124th/ 347
METRIC RANK
12.5%
FEMALE POVERTY
94.1/ 100
METRIC RATING
105th/ 347
METRIC RANK
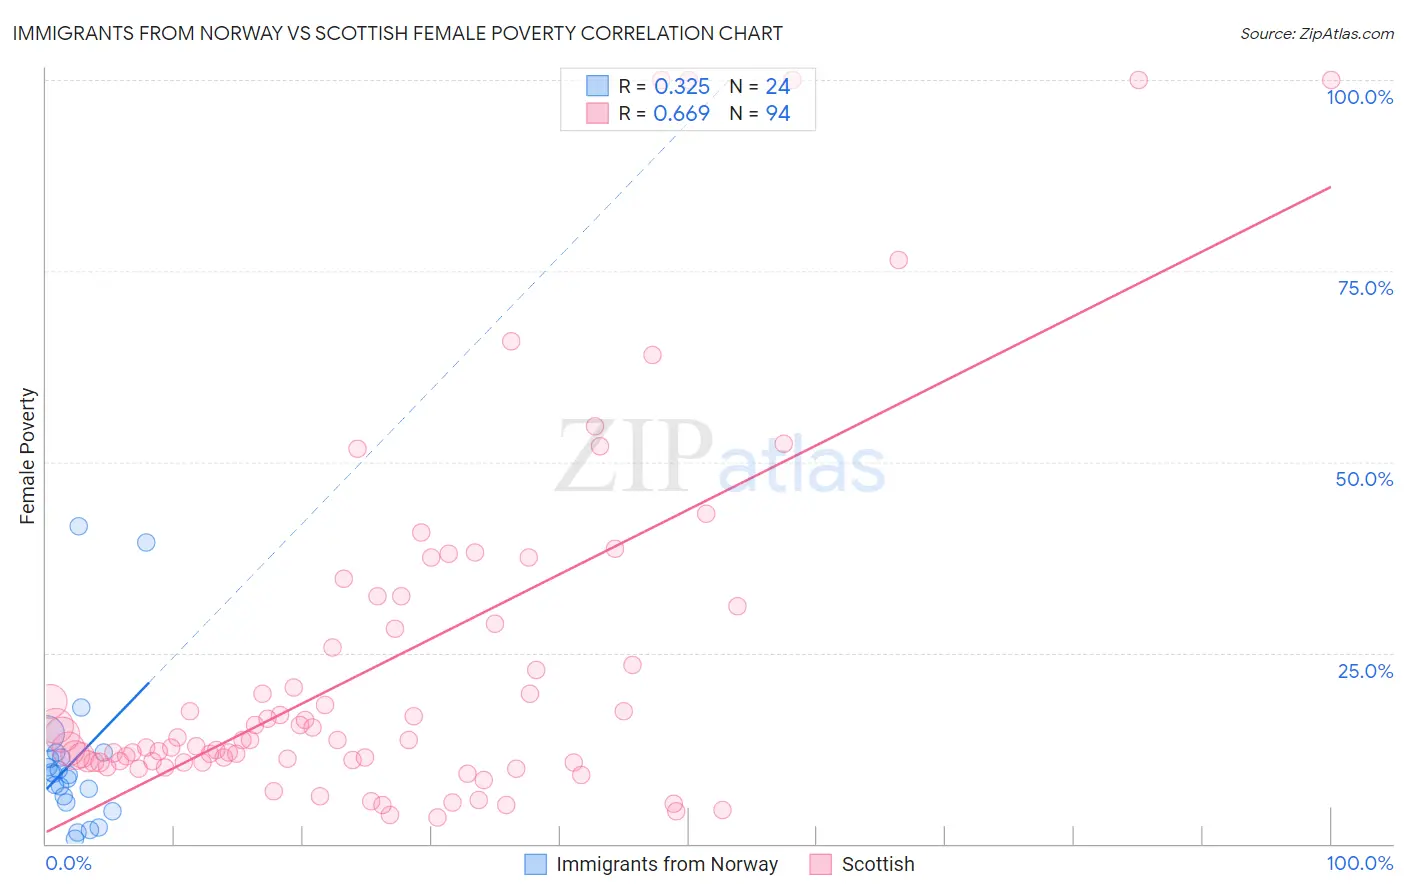
Immigrants from Norway vs Scottish Female Poverty Correlation Chart
The statistical analysis conducted on geographies consisting of 116,674,936 people shows a mild positive correlation between the proportion of Immigrants from Norway and poverty level among females in the United States with a correlation coefficient (R) of 0.325 and weighted average of 12.8%. Similarly, the statistical analysis conducted on geographies consisting of 565,877,668 people shows a significant positive correlation between the proportion of Scottish and poverty level among females in the United States with a correlation coefficient (R) of 0.669 and weighted average of 12.5%, a difference of 1.7%.
Female Poverty Correlation Summary
| Measurement | Immigrants from Norway | Scottish |
| Minimum | 0.68% | 3.5% |
| Maximum | 41.6% | 100.0% |
| Range | 40.9% | 96.5% |
| Mean | 10.8% | 23.6% |
| Median | 9.1% | 13.6% |
| Interquartile 25% (IQ1) | 5.8% | 10.7% |
| Interquartile 75% (IQ3) | 11.6% | 28.8% |
| Interquartile Range (IQR) | 5.8% | 18.1% |
| Standard Deviation (Sample) | 10.0% | 23.5% |
| Standard Deviation (Population) | 9.8% | 23.4% |
Demographics Similar to Immigrants from Norway and Scottish by Female Poverty
In terms of female poverty, the demographic groups most similar to Immigrants from Norway are Immigrants from South Eastern Asia (12.7%, a difference of 0.18%), French Canadian (12.7%, a difference of 0.24%), Immigrants from Hungary (12.7%, a difference of 0.28%), New Zealander (12.7%, a difference of 0.39%), and Albanian (12.7%, a difference of 0.45%). Similarly, the demographic groups most similar to Scottish are Palestinian (12.5%, a difference of 0.11%), Immigrants from Turkey (12.6%, a difference of 0.12%), Laotian (12.6%, a difference of 0.31%), Portuguese (12.6%, a difference of 0.42%), and Immigrants from Zimbabwe (12.6%, a difference of 0.43%).
| Demographics | Rating | Rank | Female Poverty |
| Palestinians | 94.3 /100 | #104 | Exceptional 12.5% |
| Scottish | 94.1 /100 | #105 | Exceptional 12.5% |
| Immigrants | Turkey | 93.8 /100 | #106 | Exceptional 12.6% |
| Laotians | 93.4 /100 | #107 | Exceptional 12.6% |
| Portuguese | 93.1 /100 | #108 | Exceptional 12.6% |
| Immigrants | Zimbabwe | 93.1 /100 | #109 | Exceptional 12.6% |
| Paraguayans | 93.0 /100 | #110 | Exceptional 12.6% |
| Soviet Union | 92.4 /100 | #111 | Exceptional 12.6% |
| Immigrants | Israel | 92.0 /100 | #112 | Exceptional 12.6% |
| Canadians | 92.0 /100 | #113 | Exceptional 12.7% |
| Welsh | 91.6 /100 | #114 | Exceptional 12.7% |
| Puget Sound Salish | 91.5 /100 | #115 | Exceptional 12.7% |
| Immigrants | Russia | 91.2 /100 | #116 | Exceptional 12.7% |
| Immigrants | Southern Europe | 90.9 /100 | #117 | Exceptional 12.7% |
| Sri Lankans | 90.9 /100 | #118 | Exceptional 12.7% |
| Albanians | 90.8 /100 | #119 | Exceptional 12.7% |
| New Zealanders | 90.6 /100 | #120 | Exceptional 12.7% |
| Immigrants | Hungary | 90.3 /100 | #121 | Exceptional 12.7% |
| French Canadians | 90.2 /100 | #122 | Exceptional 12.7% |
| Immigrants | South Eastern Asia | 89.9 /100 | #123 | Excellent 12.7% |
| Immigrants | Norway | 89.3 /100 | #124 | Excellent 12.8% |