Immigrants from Romania vs Immigrants from Nicaragua Married-Couple Family Poverty
COMPARE
Immigrants from Romania
Immigrants from Nicaragua
Married-Couple Family Poverty
Married-Couple Family Poverty Comparison
Immigrants from Romania
Immigrants from Nicaragua
4.7%
MARRIED-COUPLE FAMILY POVERTY
97.3/ 100
METRIC RATING
103rd/ 347
METRIC RANK
7.1%
MARRIED-COUPLE FAMILY POVERTY
0.0/ 100
METRIC RATING
310th/ 347
METRIC RANK
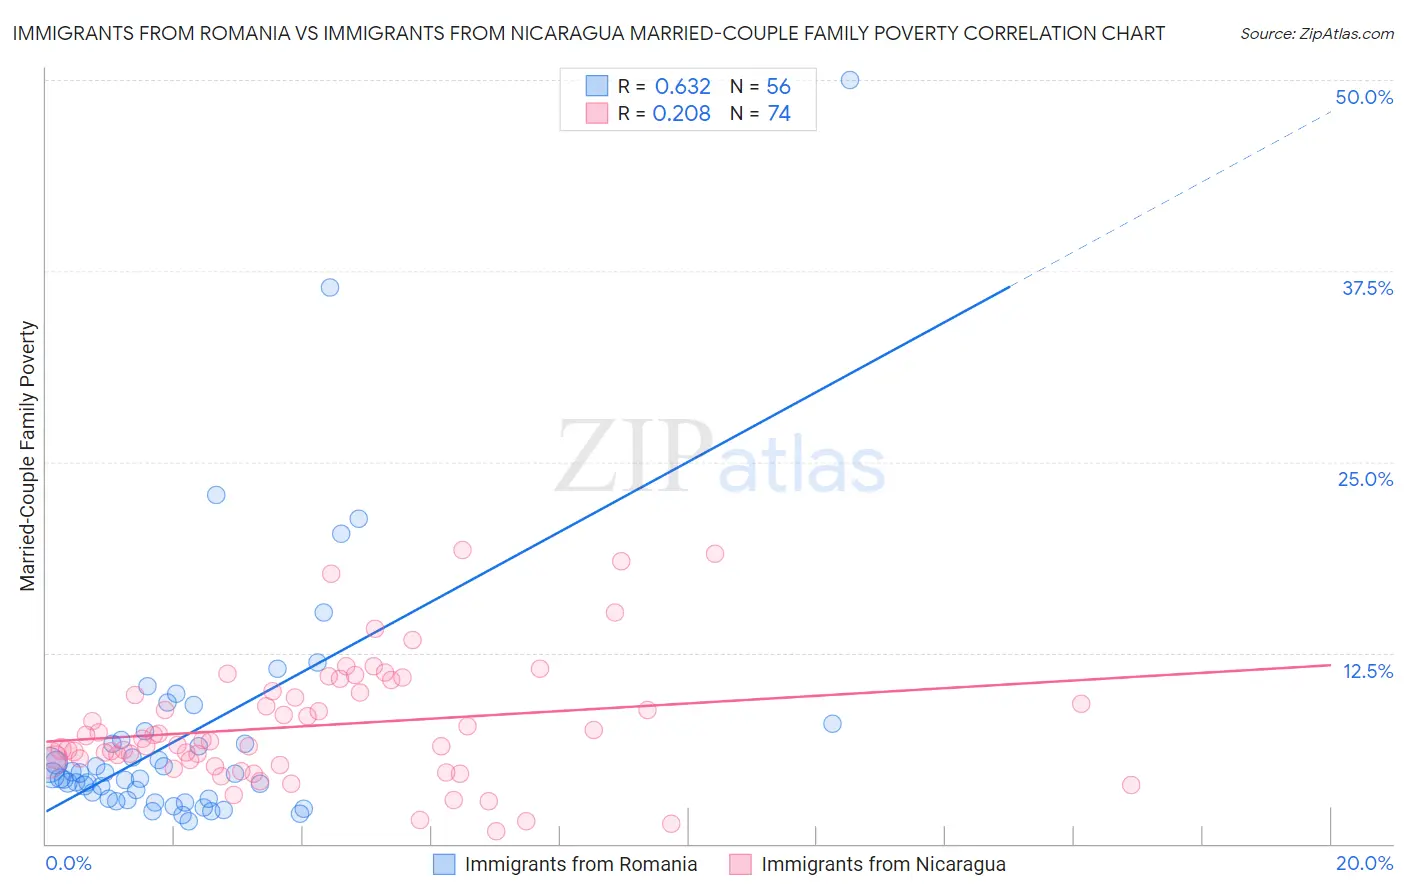
Immigrants from Romania vs Immigrants from Nicaragua Married-Couple Family Poverty Correlation Chart
The statistical analysis conducted on geographies consisting of 255,676,243 people shows a significant positive correlation between the proportion of Immigrants from Romania and poverty level among married-couple families in the United States with a correlation coefficient (R) of 0.632 and weighted average of 4.7%. Similarly, the statistical analysis conducted on geographies consisting of 235,581,482 people shows a weak positive correlation between the proportion of Immigrants from Nicaragua and poverty level among married-couple families in the United States with a correlation coefficient (R) of 0.208 and weighted average of 7.1%, a difference of 51.8%.
Married-Couple Family Poverty Correlation Summary
| Measurement | Immigrants from Romania | Immigrants from Nicaragua |
| Minimum | 1.5% | 0.79% |
| Maximum | 50.0% | 19.2% |
| Range | 48.5% | 18.4% |
| Mean | 7.3% | 7.7% |
| Median | 4.5% | 6.8% |
| Interquartile 25% (IQ1) | 2.9% | 5.5% |
| Interquartile 75% (IQ3) | 7.1% | 9.9% |
| Interquartile Range (IQR) | 4.2% | 4.4% |
| Standard Deviation (Sample) | 8.5% | 4.0% |
| Standard Deviation (Population) | 8.4% | 3.9% |
Similar Demographics by Married-Couple Family Poverty
Demographics Similar to Immigrants from Romania by Married-Couple Family Poverty
In terms of married-couple family poverty, the demographic groups most similar to Immigrants from Romania are Asian (4.7%, a difference of 0.29%), Immigrants from Moldova (4.7%, a difference of 0.34%), Aleut (4.7%, a difference of 0.41%), Immigrants from France (4.7%, a difference of 0.57%), and Immigrants from Germany (4.7%, a difference of 0.58%).
| Demographics | Rating | Rank | Married-Couple Family Poverty |
| Immigrants | Poland | 98.3 /100 | #96 | Exceptional 4.6% |
| Immigrants | Belgium | 98.2 /100 | #97 | Exceptional 4.6% |
| Native Hawaiians | 98.0 /100 | #98 | Exceptional 4.6% |
| Immigrants | Europe | 97.9 /100 | #99 | Exceptional 4.6% |
| Immigrants | Western Europe | 97.9 /100 | #100 | Exceptional 4.6% |
| Yugoslavians | 97.8 /100 | #101 | Exceptional 4.6% |
| Asians | 97.6 /100 | #102 | Exceptional 4.7% |
| Immigrants | Romania | 97.3 /100 | #103 | Exceptional 4.7% |
| Immigrants | Moldova | 97.1 /100 | #104 | Exceptional 4.7% |
| Aleuts | 97.0 /100 | #105 | Exceptional 4.7% |
| Immigrants | France | 96.9 /100 | #106 | Exceptional 4.7% |
| Immigrants | Germany | 96.8 /100 | #107 | Exceptional 4.7% |
| Laotians | 96.6 /100 | #108 | Exceptional 4.7% |
| Immigrants | Hong Kong | 96.4 /100 | #109 | Exceptional 4.7% |
| Immigrants | Bolivia | 96.2 /100 | #110 | Exceptional 4.7% |
Demographics Similar to Immigrants from Nicaragua by Married-Couple Family Poverty
In terms of married-couple family poverty, the demographic groups most similar to Immigrants from Nicaragua are Hopi (7.1%, a difference of 0.030%), Immigrants from Dominica (7.1%, a difference of 0.050%), Immigrants from Armenia (7.1%, a difference of 0.050%), Immigrants from St. Vincent and the Grenadines (7.1%, a difference of 0.17%), and British West Indian (7.1%, a difference of 0.47%).
| Demographics | Rating | Rank | Married-Couple Family Poverty |
| Immigrants | El Salvador | 0.0 /100 | #303 | Tragic 6.8% |
| Cubans | 0.0 /100 | #304 | Tragic 6.8% |
| Haitians | 0.0 /100 | #305 | Tragic 6.8% |
| Immigrants | Haiti | 0.0 /100 | #306 | Tragic 7.0% |
| Guatemalans | 0.0 /100 | #307 | Tragic 7.0% |
| Spanish American Indians | 0.0 /100 | #308 | Tragic 7.1% |
| Hopi | 0.0 /100 | #309 | Tragic 7.1% |
| Immigrants | Nicaragua | 0.0 /100 | #310 | Tragic 7.1% |
| Immigrants | Dominica | 0.0 /100 | #311 | Tragic 7.1% |
| Immigrants | Armenia | 0.0 /100 | #312 | Tragic 7.1% |
| Immigrants | St. Vincent and the Grenadines | 0.0 /100 | #313 | Tragic 7.1% |
| British West Indians | 0.0 /100 | #314 | Tragic 7.1% |
| Inupiat | 0.0 /100 | #315 | Tragic 7.1% |
| Hondurans | 0.0 /100 | #316 | Tragic 7.2% |
| Mexicans | 0.0 /100 | #317 | Tragic 7.2% |