Immigrants from Romania vs Scotch-Irish Married-Couple Family Poverty
COMPARE
Immigrants from Romania
Scotch-Irish
Married-Couple Family Poverty
Married-Couple Family Poverty Comparison
Immigrants from Romania
Scotch-Irish
4.7%
MARRIED-COUPLE FAMILY POVERTY
97.3/ 100
METRIC RATING
103rd/ 347
METRIC RANK
4.5%
MARRIED-COUPLE FAMILY POVERTY
99.1/ 100
METRIC RATING
78th/ 347
METRIC RANK
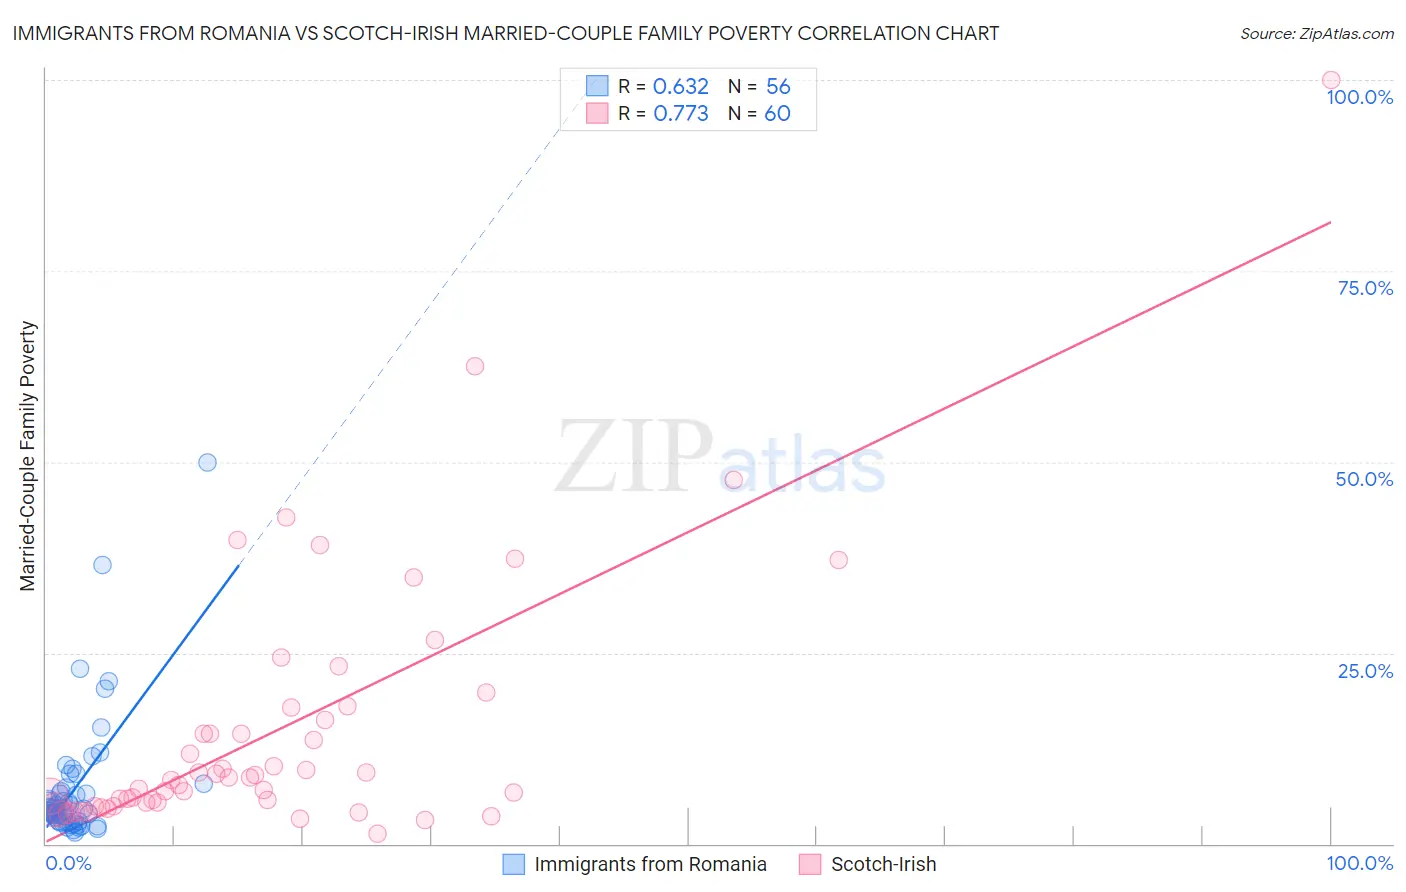
Immigrants from Romania vs Scotch-Irish Married-Couple Family Poverty Correlation Chart
The statistical analysis conducted on geographies consisting of 255,676,243 people shows a significant positive correlation between the proportion of Immigrants from Romania and poverty level among married-couple families in the United States with a correlation coefficient (R) of 0.632 and weighted average of 4.7%. Similarly, the statistical analysis conducted on geographies consisting of 536,697,572 people shows a strong positive correlation between the proportion of Scotch-Irish and poverty level among married-couple families in the United States with a correlation coefficient (R) of 0.773 and weighted average of 4.5%, a difference of 3.5%.
Married-Couple Family Poverty Correlation Summary
| Measurement | Immigrants from Romania | Scotch-Irish |
| Minimum | 1.5% | 1.4% |
| Maximum | 50.0% | 100.0% |
| Range | 48.5% | 98.6% |
| Mean | 7.3% | 14.9% |
| Median | 4.5% | 8.5% |
| Interquartile 25% (IQ1) | 2.9% | 5.1% |
| Interquartile 75% (IQ3) | 7.1% | 17.0% |
| Interquartile Range (IQR) | 4.2% | 11.9% |
| Standard Deviation (Sample) | 8.5% | 17.2% |
| Standard Deviation (Population) | 8.4% | 17.1% |
Similar Demographics by Married-Couple Family Poverty
Demographics Similar to Immigrants from Romania by Married-Couple Family Poverty
In terms of married-couple family poverty, the demographic groups most similar to Immigrants from Romania are Asian (4.7%, a difference of 0.29%), Immigrants from Moldova (4.7%, a difference of 0.34%), Aleut (4.7%, a difference of 0.41%), Immigrants from France (4.7%, a difference of 0.57%), and Immigrants from Germany (4.7%, a difference of 0.58%).
| Demographics | Rating | Rank | Married-Couple Family Poverty |
| Immigrants | Poland | 98.3 /100 | #96 | Exceptional 4.6% |
| Immigrants | Belgium | 98.2 /100 | #97 | Exceptional 4.6% |
| Native Hawaiians | 98.0 /100 | #98 | Exceptional 4.6% |
| Immigrants | Europe | 97.9 /100 | #99 | Exceptional 4.6% |
| Immigrants | Western Europe | 97.9 /100 | #100 | Exceptional 4.6% |
| Yugoslavians | 97.8 /100 | #101 | Exceptional 4.6% |
| Asians | 97.6 /100 | #102 | Exceptional 4.7% |
| Immigrants | Romania | 97.3 /100 | #103 | Exceptional 4.7% |
| Immigrants | Moldova | 97.1 /100 | #104 | Exceptional 4.7% |
| Aleuts | 97.0 /100 | #105 | Exceptional 4.7% |
| Immigrants | France | 96.9 /100 | #106 | Exceptional 4.7% |
| Immigrants | Germany | 96.8 /100 | #107 | Exceptional 4.7% |
| Laotians | 96.6 /100 | #108 | Exceptional 4.7% |
| Immigrants | Hong Kong | 96.4 /100 | #109 | Exceptional 4.7% |
| Immigrants | Bolivia | 96.2 /100 | #110 | Exceptional 4.7% |
Demographics Similar to Scotch-Irish by Married-Couple Family Poverty
In terms of married-couple family poverty, the demographic groups most similar to Scotch-Irish are Immigrants from Latvia (4.5%, a difference of 0.080%), Immigrants from Iran (4.5%, a difference of 0.23%), Immigrants from South Africa (4.5%, a difference of 0.25%), Icelander (4.5%, a difference of 0.29%), and Cambodian (4.5%, a difference of 0.36%).
| Demographics | Rating | Rank | Married-Couple Family Poverty |
| Immigrants | North America | 99.3 /100 | #71 | Exceptional 4.5% |
| Immigrants | England | 99.3 /100 | #72 | Exceptional 4.5% |
| Ukrainians | 99.2 /100 | #73 | Exceptional 4.5% |
| Immigrants | Austria | 99.2 /100 | #74 | Exceptional 4.5% |
| Cambodians | 99.2 /100 | #75 | Exceptional 4.5% |
| Immigrants | South Africa | 99.1 /100 | #76 | Exceptional 4.5% |
| Immigrants | Latvia | 99.1 /100 | #77 | Exceptional 4.5% |
| Scotch-Irish | 99.1 /100 | #78 | Exceptional 4.5% |
| Immigrants | Iran | 99.0 /100 | #79 | Exceptional 4.5% |
| Icelanders | 99.0 /100 | #80 | Exceptional 4.5% |
| Immigrants | Greece | 98.9 /100 | #81 | Exceptional 4.5% |
| Canadians | 98.8 /100 | #82 | Exceptional 4.5% |
| Immigrants | Denmark | 98.8 /100 | #83 | Exceptional 4.6% |
| Immigrants | Croatia | 98.7 /100 | #84 | Exceptional 4.6% |
| South Africans | 98.7 /100 | #85 | Exceptional 4.6% |