Immigrants from Romania vs Immigrants from Nicaragua In Labor Force | Age > 16
COMPARE
Immigrants from Romania
Immigrants from Nicaragua
In Labor Force | Age > 16
In Labor Force | Age > 16 Comparison
Immigrants from Romania
Immigrants from Nicaragua
65.5%
IN LABOR FORCE | AGE > 16
88.6/ 100
METRIC RATING
144th/ 347
METRIC RANK
65.1%
IN LABOR FORCE | AGE > 16
41.1/ 100
METRIC RATING
182nd/ 347
METRIC RANK
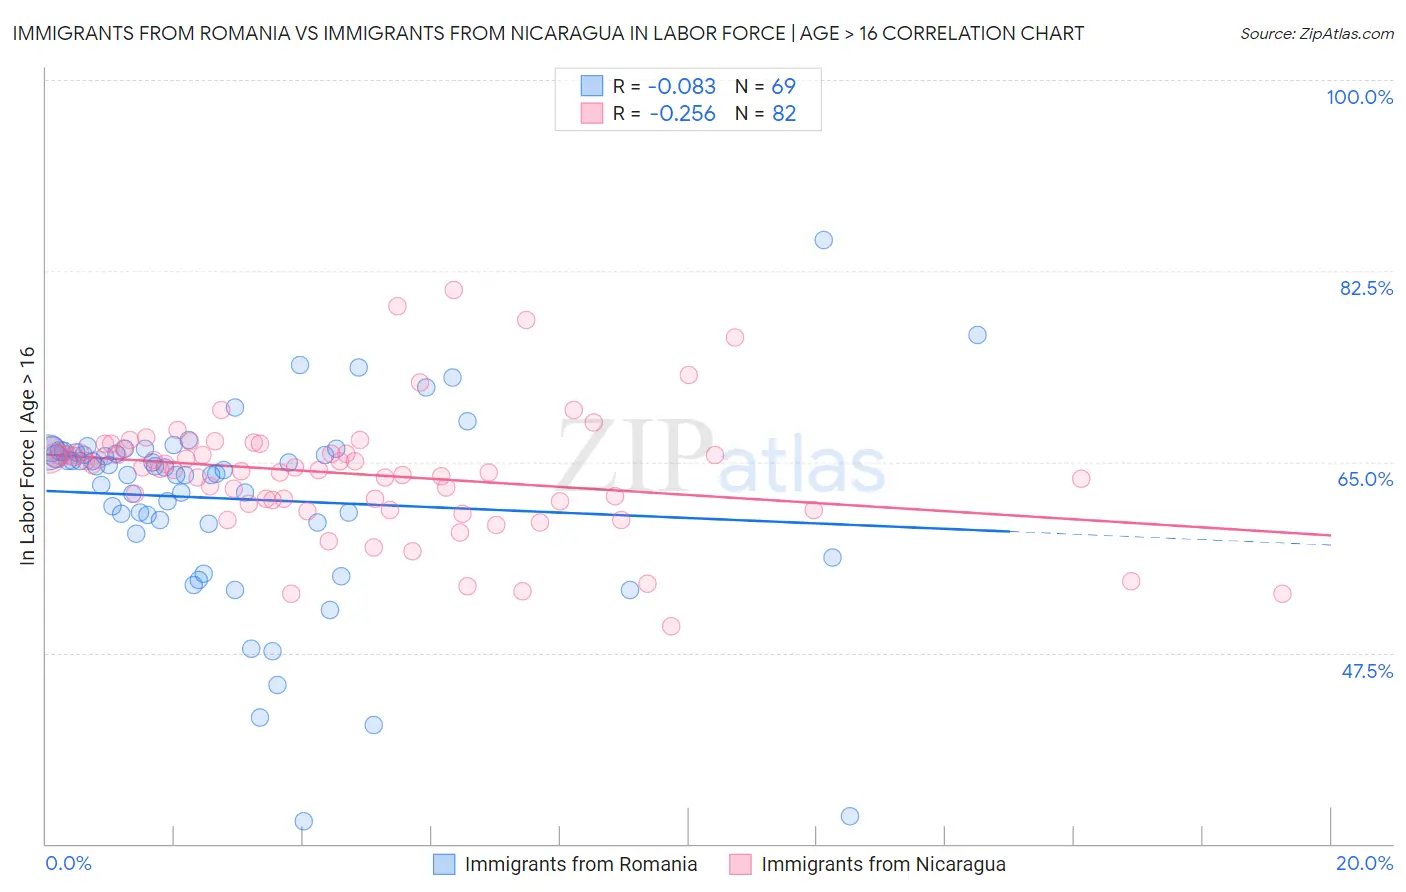
Immigrants from Romania vs Immigrants from Nicaragua In Labor Force | Age > 16 Correlation Chart
The statistical analysis conducted on geographies consisting of 257,014,238 people shows a slight negative correlation between the proportion of Immigrants from Romania and labor force participation rate among population ages 16 and over in the United States with a correlation coefficient (R) of -0.083 and weighted average of 65.5%. Similarly, the statistical analysis conducted on geographies consisting of 236,332,108 people shows a weak negative correlation between the proportion of Immigrants from Nicaragua and labor force participation rate among population ages 16 and over in the United States with a correlation coefficient (R) of -0.256 and weighted average of 65.1%, a difference of 0.68%.
In Labor Force | Age > 16 Correlation Summary
| Measurement | Immigrants from Romania | Immigrants from Nicaragua |
| Minimum | 32.1% | 49.9% |
| Maximum | 85.3% | 80.8% |
| Range | 53.2% | 30.9% |
| Mean | 61.6% | 63.9% |
| Median | 64.3% | 64.4% |
| Interquartile 25% (IQ1) | 59.4% | 61.4% |
| Interquartile 75% (IQ3) | 66.0% | 65.8% |
| Interquartile Range (IQR) | 6.6% | 4.4% |
| Standard Deviation (Sample) | 9.1% | 5.5% |
| Standard Deviation (Population) | 9.0% | 5.5% |
Similar Demographics by In Labor Force | Age > 16
Demographics Similar to Immigrants from Romania by In Labor Force | Age > 16
In terms of in labor force | age > 16, the demographic groups most similar to Immigrants from Romania are Tlingit-Haida (65.5%, a difference of 0.010%), Cypriot (65.5%, a difference of 0.010%), Indian (Asian) (65.5%, a difference of 0.020%), Latvian (65.5%, a difference of 0.020%), and Immigrants from Oceania (65.5%, a difference of 0.030%).
| Demographics | Rating | Rank | In Labor Force | Age > 16 |
| Guamanians/Chamorros | 92.4 /100 | #137 | Exceptional 65.6% |
| Immigrants | West Indies | 92.0 /100 | #138 | Exceptional 65.6% |
| Immigrants | Taiwan | 90.8 /100 | #139 | Exceptional 65.5% |
| Immigrants | Costa Rica | 90.8 /100 | #140 | Exceptional 65.5% |
| Samoans | 90.5 /100 | #141 | Exceptional 65.5% |
| Indians (Asian) | 89.5 /100 | #142 | Excellent 65.5% |
| Latvians | 89.4 /100 | #143 | Excellent 65.5% |
| Immigrants | Romania | 88.6 /100 | #144 | Excellent 65.5% |
| Tlingit-Haida | 88.3 /100 | #145 | Excellent 65.5% |
| Cypriots | 88.2 /100 | #146 | Excellent 65.5% |
| Immigrants | Oceania | 87.5 /100 | #147 | Excellent 65.5% |
| Bhutanese | 86.3 /100 | #148 | Excellent 65.5% |
| Immigrants | Albania | 85.7 /100 | #149 | Excellent 65.4% |
| Immigrants | Immigrants | 81.9 /100 | #150 | Excellent 65.4% |
| Czechs | 81.5 /100 | #151 | Excellent 65.4% |
Demographics Similar to Immigrants from Nicaragua by In Labor Force | Age > 16
In terms of in labor force | age > 16, the demographic groups most similar to Immigrants from Nicaragua are Soviet Union (65.0%, a difference of 0.010%), Carpatho Rusyn (65.0%, a difference of 0.010%), Syrian (65.0%, a difference of 0.010%), Immigrants from Latvia (65.1%, a difference of 0.020%), and Immigrants from Panama (65.1%, a difference of 0.020%).
| Demographics | Rating | Rank | In Labor Force | Age > 16 |
| Nicaraguans | 49.7 /100 | #175 | Average 65.1% |
| Swedes | 47.4 /100 | #176 | Average 65.1% |
| Eastern Europeans | 46.2 /100 | #177 | Average 65.1% |
| Trinidadians and Tobagonians | 45.2 /100 | #178 | Average 65.1% |
| Immigrants | Haiti | 43.3 /100 | #179 | Average 65.1% |
| Immigrants | Latvia | 42.9 /100 | #180 | Average 65.1% |
| Immigrants | Panama | 42.4 /100 | #181 | Average 65.1% |
| Immigrants | Nicaragua | 41.1 /100 | #182 | Average 65.1% |
| Soviet Union | 40.5 /100 | #183 | Average 65.0% |
| Carpatho Rusyns | 40.0 /100 | #184 | Average 65.0% |
| Syrians | 40.0 /100 | #185 | Average 65.0% |
| Immigrants | Switzerland | 38.2 /100 | #186 | Fair 65.0% |
| Immigrants | Croatia | 35.7 /100 | #187 | Fair 65.0% |
| Immigrants | Portugal | 34.8 /100 | #188 | Fair 65.0% |
| Immigrants | Greece | 34.3 /100 | #189 | Fair 65.0% |