Greek vs Alaskan Athabascan Female Poverty
COMPARE
Greek
Alaskan Athabascan
Female Poverty
Female Poverty Comparison
Greeks
Alaskan Athabascans
11.7%
FEMALE POVERTY
99.5/ 100
METRIC RATING
30th/ 347
METRIC RANK
14.4%
FEMALE POVERTY
5.3/ 100
METRIC RATING
213th/ 347
METRIC RANK
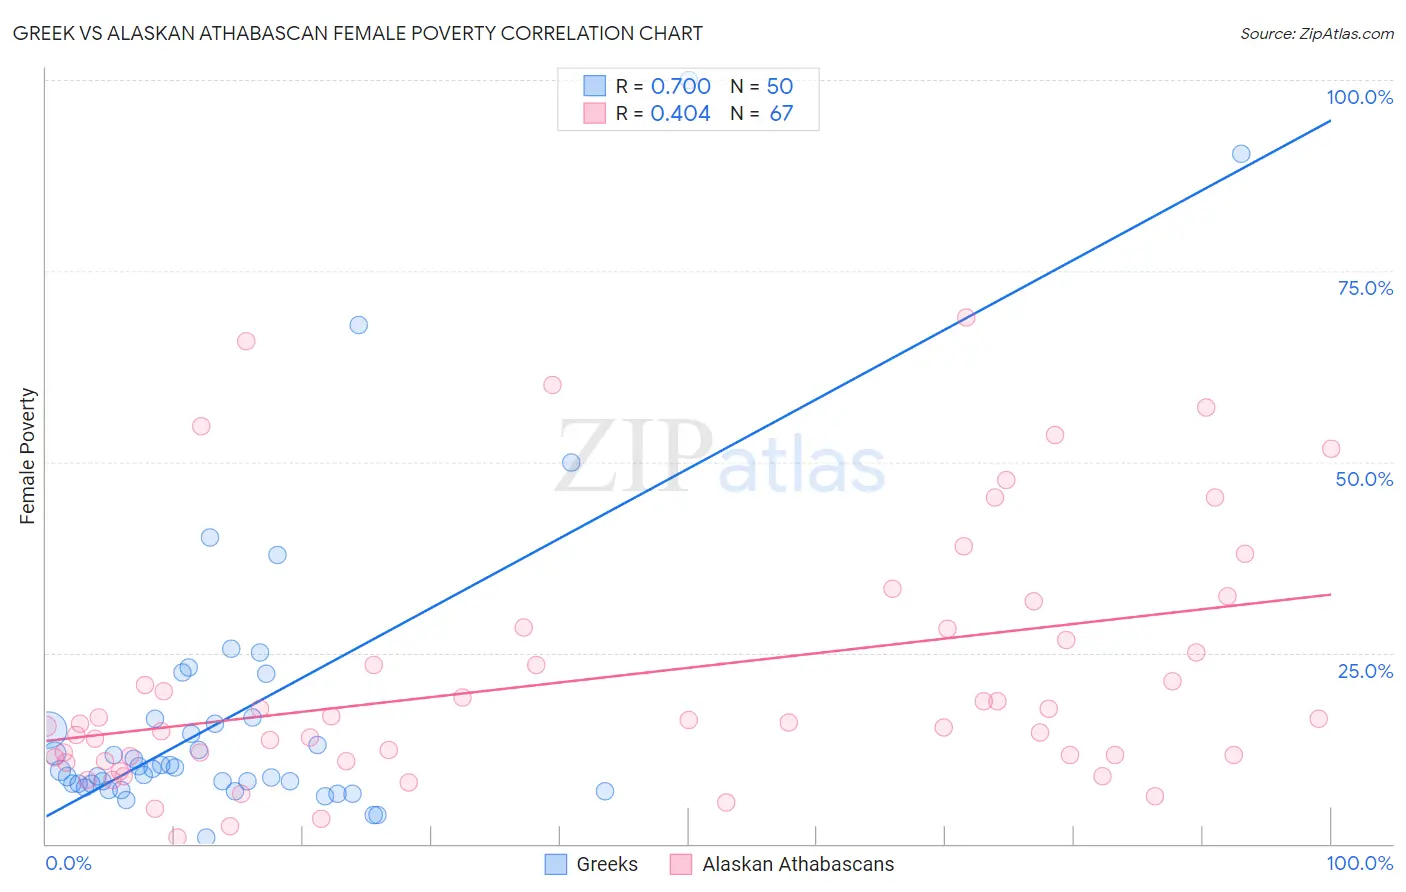
Greek vs Alaskan Athabascan Female Poverty Correlation Chart
The statistical analysis conducted on geographies consisting of 482,170,203 people shows a significant positive correlation between the proportion of Greeks and poverty level among females in the United States with a correlation coefficient (R) of 0.700 and weighted average of 11.7%. Similarly, the statistical analysis conducted on geographies consisting of 45,807,044 people shows a moderate positive correlation between the proportion of Alaskan Athabascans and poverty level among females in the United States with a correlation coefficient (R) of 0.404 and weighted average of 14.4%, a difference of 22.8%.
Female Poverty Correlation Summary
| Measurement | Greek | Alaskan Athabascan |
| Minimum | 0.85% | 0.78% |
| Maximum | 100.0% | 69.0% |
| Range | 99.2% | 68.2% |
| Mean | 17.3% | 21.7% |
| Median | 9.9% | 15.9% |
| Interquartile 25% (IQ1) | 7.9% | 11.4% |
| Interquartile 75% (IQ3) | 16.3% | 28.2% |
| Interquartile Range (IQR) | 8.5% | 16.9% |
| Standard Deviation (Sample) | 20.2% | 16.4% |
| Standard Deviation (Population) | 20.0% | 16.3% |
Similar Demographics by Female Poverty
Demographics Similar to Greeks by Female Poverty
In terms of female poverty, the demographic groups most similar to Greeks are Immigrants from North Macedonia (11.7%, a difference of 0.080%), Polish (11.7%, a difference of 0.22%), Immigrants from Korea (11.7%, a difference of 0.23%), Danish (11.7%, a difference of 0.35%), and Cypriot (11.8%, a difference of 0.42%).
| Demographics | Rating | Rank | Female Poverty |
| Burmese | 99.7 /100 | #23 | Exceptional 11.6% |
| Luxembourgers | 99.7 /100 | #24 | Exceptional 11.6% |
| Immigrants | Northern Europe | 99.6 /100 | #25 | Exceptional 11.6% |
| Croatians | 99.6 /100 | #26 | Exceptional 11.6% |
| Iranians | 99.6 /100 | #27 | Exceptional 11.7% |
| Immigrants | Korea | 99.6 /100 | #28 | Exceptional 11.7% |
| Immigrants | North Macedonia | 99.6 /100 | #29 | Exceptional 11.7% |
| Greeks | 99.5 /100 | #30 | Exceptional 11.7% |
| Poles | 99.5 /100 | #31 | Exceptional 11.7% |
| Danes | 99.5 /100 | #32 | Exceptional 11.7% |
| Cypriots | 99.5 /100 | #33 | Exceptional 11.8% |
| Immigrants | Singapore | 99.4 /100 | #34 | Exceptional 11.8% |
| Immigrants | Iran | 99.4 /100 | #35 | Exceptional 11.8% |
| Immigrants | Pakistan | 99.4 /100 | #36 | Exceptional 11.8% |
| Immigrants | Greece | 99.3 /100 | #37 | Exceptional 11.8% |
Demographics Similar to Alaskan Athabascans by Female Poverty
In terms of female poverty, the demographic groups most similar to Alaskan Athabascans are Bermudan (14.4%, a difference of 0.080%), Marshallese (14.4%, a difference of 0.16%), Immigrants from Panama (14.4%, a difference of 0.30%), Immigrants from Thailand (14.4%, a difference of 0.39%), and Immigrants (14.4%, a difference of 0.42%).
| Demographics | Rating | Rank | Female Poverty |
| Immigrants | Uruguay | 14.0 /100 | #206 | Poor 14.0% |
| Immigrants | Eastern Africa | 9.0 /100 | #207 | Tragic 14.2% |
| Immigrants | Azores | 7.9 /100 | #208 | Tragic 14.2% |
| Panamanians | 7.7 /100 | #209 | Tragic 14.2% |
| Malaysians | 7.4 /100 | #210 | Tragic 14.3% |
| Moroccans | 7.2 /100 | #211 | Tragic 14.3% |
| Bermudans | 5.5 /100 | #212 | Tragic 14.4% |
| Alaskan Athabascans | 5.3 /100 | #213 | Tragic 14.4% |
| Marshallese | 5.0 /100 | #214 | Tragic 14.4% |
| Immigrants | Panama | 4.7 /100 | #215 | Tragic 14.4% |
| Immigrants | Thailand | 4.5 /100 | #216 | Tragic 14.4% |
| Immigrants | Immigrants | 4.5 /100 | #217 | Tragic 14.4% |
| Immigrants | Uzbekistan | 4.4 /100 | #218 | Tragic 14.4% |
| Japanese | 4.1 /100 | #219 | Tragic 14.5% |
| Alsatians | 4.0 /100 | #220 | Tragic 14.5% |