Immigrants from Peru vs Hopi Female Poverty
COMPARE
Immigrants from Peru
Hopi
Female Poverty
Female Poverty Comparison
Immigrants from Peru
Hopi
13.0%
FEMALE POVERTY
79.1/ 100
METRIC RATING
146th/ 347
METRIC RANK
21.0%
FEMALE POVERTY
0.0/ 100
METRIC RATING
339th/ 347
METRIC RANK
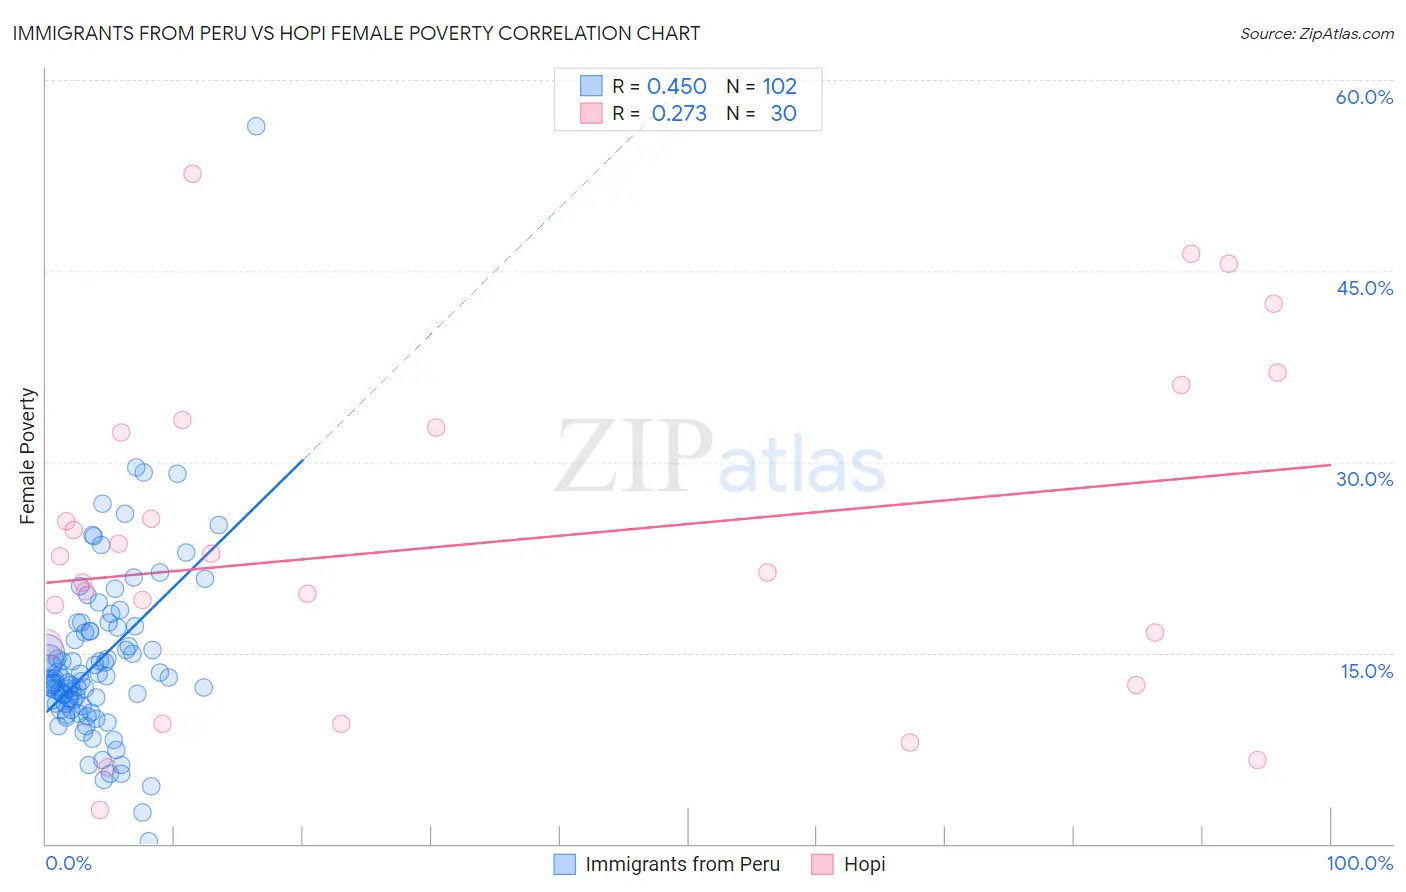
Immigrants from Peru vs Hopi Female Poverty Correlation Chart
The statistical analysis conducted on geographies consisting of 328,728,905 people shows a moderate positive correlation between the proportion of Immigrants from Peru and poverty level among females in the United States with a correlation coefficient (R) of 0.450 and weighted average of 13.0%. Similarly, the statistical analysis conducted on geographies consisting of 74,730,236 people shows a weak positive correlation between the proportion of Hopi and poverty level among females in the United States with a correlation coefficient (R) of 0.273 and weighted average of 21.0%, a difference of 61.1%.
Female Poverty Correlation Summary
| Measurement | Immigrants from Peru | Hopi |
| Minimum | 0.21% | 2.6% |
| Maximum | 56.3% | 52.7% |
| Range | 56.1% | 50.0% |
| Mean | 14.4% | 23.6% |
| Median | 12.8% | 22.0% |
| Interquartile 25% (IQ1) | 11.0% | 15.6% |
| Interquartile 75% (IQ3) | 16.7% | 32.7% |
| Interquartile Range (IQR) | 5.7% | 17.1% |
| Standard Deviation (Sample) | 7.0% | 12.9% |
| Standard Deviation (Population) | 7.0% | 12.7% |
Similar Demographics by Female Poverty
Demographics Similar to Immigrants from Peru by Female Poverty
In terms of female poverty, the demographic groups most similar to Immigrants from Peru are Syrian (13.0%, a difference of 0.080%), Immigrants from Kazakhstan (13.0%, a difference of 0.080%), Afghan (13.0%, a difference of 0.11%), Immigrants from Malaysia (13.0%, a difference of 0.19%), and Brazilian (13.0%, a difference of 0.22%).
| Demographics | Rating | Rank | Female Poverty |
| Basques | 83.1 /100 | #139 | Excellent 12.9% |
| Pakistanis | 83.0 /100 | #140 | Excellent 12.9% |
| Icelanders | 81.1 /100 | #141 | Excellent 13.0% |
| Brazilians | 80.5 /100 | #142 | Excellent 13.0% |
| Immigrants | Malaysia | 80.4 /100 | #143 | Excellent 13.0% |
| Afghans | 79.8 /100 | #144 | Good 13.0% |
| Syrians | 79.6 /100 | #145 | Good 13.0% |
| Immigrants | Peru | 79.1 /100 | #146 | Good 13.0% |
| Immigrants | Kazakhstan | 78.6 /100 | #147 | Good 13.0% |
| Yugoslavians | 76.9 /100 | #148 | Good 13.1% |
| Taiwanese | 75.7 /100 | #149 | Good 13.1% |
| Tsimshian | 75.5 /100 | #150 | Good 13.1% |
| Immigrants | Germany | 74.9 /100 | #151 | Good 13.1% |
| Samoans | 73.6 /100 | #152 | Good 13.1% |
| Immigrants | Fiji | 71.0 /100 | #153 | Good 13.2% |
Demographics Similar to Hopi by Female Poverty
In terms of female poverty, the demographic groups most similar to Hopi are Sioux (20.9%, a difference of 0.37%), Yuman (20.8%, a difference of 0.56%), Pueblo (20.7%, a difference of 1.4%), Yup'ik (21.5%, a difference of 2.5%), and Cheyenne (20.2%, a difference of 3.8%).
| Demographics | Rating | Rank | Female Poverty |
| Apache | 0.0 /100 | #332 | Tragic 19.2% |
| Immigrants | Dominican Republic | 0.0 /100 | #333 | Tragic 19.3% |
| Houma | 0.0 /100 | #334 | Tragic 20.0% |
| Cheyenne | 0.0 /100 | #335 | Tragic 20.2% |
| Pueblo | 0.0 /100 | #336 | Tragic 20.7% |
| Yuman | 0.0 /100 | #337 | Tragic 20.8% |
| Sioux | 0.0 /100 | #338 | Tragic 20.9% |
| Hopi | 0.0 /100 | #339 | Tragic 21.0% |
| Yup'ik | 0.0 /100 | #340 | Tragic 21.5% |
| Crow | 0.0 /100 | #341 | Tragic 22.1% |
| Immigrants | Yemen | 0.0 /100 | #342 | Tragic 22.8% |
| Lumbee | 0.0 /100 | #343 | Tragic 23.5% |
| Pima | 0.0 /100 | #344 | Tragic 23.6% |
| Navajo | 0.0 /100 | #345 | Tragic 23.9% |
| Puerto Ricans | 0.0 /100 | #346 | Tragic 25.2% |