Costa Rican vs Hopi Female Poverty
COMPARE
Costa Rican
Hopi
Female Poverty
Female Poverty Comparison
Costa Ricans
Hopi
13.3%
FEMALE POVERTY
63.6/ 100
METRIC RATING
159th/ 347
METRIC RANK
21.0%
FEMALE POVERTY
0.0/ 100
METRIC RATING
339th/ 347
METRIC RANK
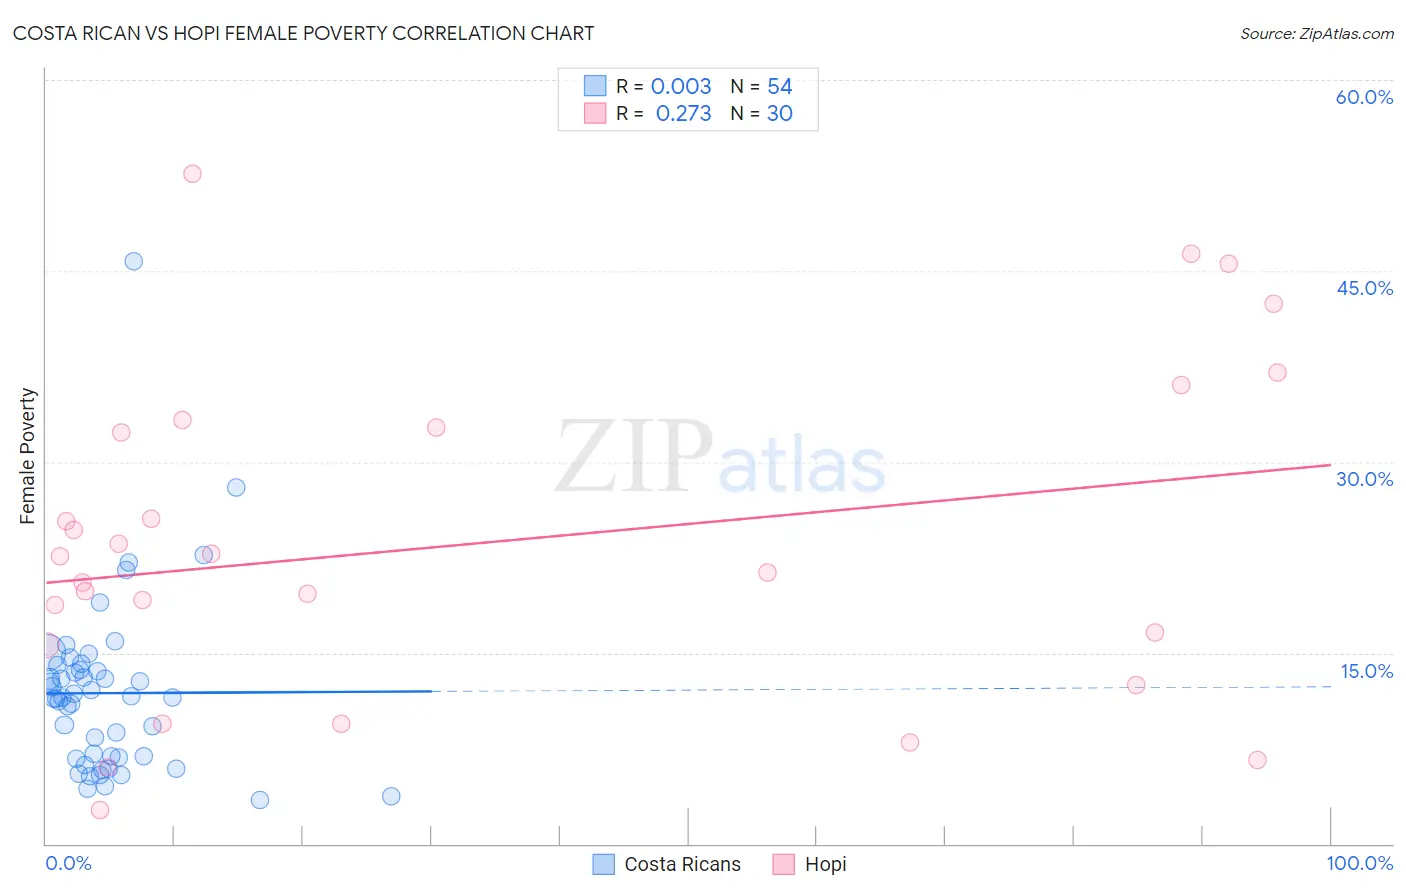
Costa Rican vs Hopi Female Poverty Correlation Chart
The statistical analysis conducted on geographies consisting of 253,437,784 people shows no correlation between the proportion of Costa Ricans and poverty level among females in the United States with a correlation coefficient (R) of 0.003 and weighted average of 13.3%. Similarly, the statistical analysis conducted on geographies consisting of 74,730,236 people shows a weak positive correlation between the proportion of Hopi and poverty level among females in the United States with a correlation coefficient (R) of 0.273 and weighted average of 21.0%, a difference of 58.1%.
Female Poverty Correlation Summary
| Measurement | Costa Rican | Hopi |
| Minimum | 3.4% | 2.6% |
| Maximum | 45.8% | 52.7% |
| Range | 42.4% | 50.0% |
| Mean | 11.8% | 23.6% |
| Median | 11.5% | 22.0% |
| Interquartile 25% (IQ1) | 6.8% | 15.6% |
| Interquartile 75% (IQ3) | 13.6% | 32.7% |
| Interquartile Range (IQR) | 6.8% | 17.1% |
| Standard Deviation (Sample) | 7.0% | 12.9% |
| Standard Deviation (Population) | 6.9% | 12.7% |
Similar Demographics by Female Poverty
Demographics Similar to Costa Ricans by Female Poverty
In terms of female poverty, the demographic groups most similar to Costa Ricans are Immigrants from Nepal (13.3%, a difference of 0.090%), Immigrants from Ethiopia (13.3%, a difference of 0.12%), Guamanian/Chamorro (13.3%, a difference of 0.12%), Immigrants from Albania (13.3%, a difference of 0.13%), and Ethiopian (13.3%, a difference of 0.14%).
| Demographics | Rating | Rank | Female Poverty |
| Samoans | 73.6 /100 | #152 | Good 13.1% |
| Immigrants | Fiji | 71.0 /100 | #153 | Good 13.2% |
| Armenians | 70.4 /100 | #154 | Good 13.2% |
| Hungarians | 70.1 /100 | #155 | Good 13.2% |
| Immigrants | Bosnia and Herzegovina | 69.7 /100 | #156 | Good 13.2% |
| Immigrants | Northern Africa | 68.8 /100 | #157 | Good 13.2% |
| Pennsylvania Germans | 67.3 /100 | #158 | Good 13.2% |
| Costa Ricans | 63.6 /100 | #159 | Good 13.3% |
| Immigrants | Nepal | 62.7 /100 | #160 | Good 13.3% |
| Immigrants | Ethiopia | 62.5 /100 | #161 | Good 13.3% |
| Guamanians/Chamorros | 62.4 /100 | #162 | Good 13.3% |
| Immigrants | Albania | 62.4 /100 | #163 | Good 13.3% |
| Ethiopians | 62.3 /100 | #164 | Good 13.3% |
| Scotch-Irish | 62.1 /100 | #165 | Good 13.3% |
| Immigrants | Oceania | 59.7 /100 | #166 | Average 13.3% |
Demographics Similar to Hopi by Female Poverty
In terms of female poverty, the demographic groups most similar to Hopi are Sioux (20.9%, a difference of 0.37%), Yuman (20.8%, a difference of 0.56%), Pueblo (20.7%, a difference of 1.4%), Yup'ik (21.5%, a difference of 2.5%), and Cheyenne (20.2%, a difference of 3.8%).
| Demographics | Rating | Rank | Female Poverty |
| Apache | 0.0 /100 | #332 | Tragic 19.2% |
| Immigrants | Dominican Republic | 0.0 /100 | #333 | Tragic 19.3% |
| Houma | 0.0 /100 | #334 | Tragic 20.0% |
| Cheyenne | 0.0 /100 | #335 | Tragic 20.2% |
| Pueblo | 0.0 /100 | #336 | Tragic 20.7% |
| Yuman | 0.0 /100 | #337 | Tragic 20.8% |
| Sioux | 0.0 /100 | #338 | Tragic 20.9% |
| Hopi | 0.0 /100 | #339 | Tragic 21.0% |
| Yup'ik | 0.0 /100 | #340 | Tragic 21.5% |
| Crow | 0.0 /100 | #341 | Tragic 22.1% |
| Immigrants | Yemen | 0.0 /100 | #342 | Tragic 22.8% |
| Lumbee | 0.0 /100 | #343 | Tragic 23.5% |
| Pima | 0.0 /100 | #344 | Tragic 23.6% |
| Navajo | 0.0 /100 | #345 | Tragic 23.9% |
| Puerto Ricans | 0.0 /100 | #346 | Tragic 25.2% |