Immigrants from Peru vs Immigrants from Cambodia Female Poverty
COMPARE
Immigrants from Peru
Immigrants from Cambodia
Female Poverty
Female Poverty Comparison
Immigrants from Peru
Immigrants from Cambodia
13.0%
FEMALE POVERTY
79.1/ 100
METRIC RATING
146th/ 347
METRIC RANK
14.5%
FEMALE POVERTY
3.7/ 100
METRIC RATING
221st/ 347
METRIC RANK
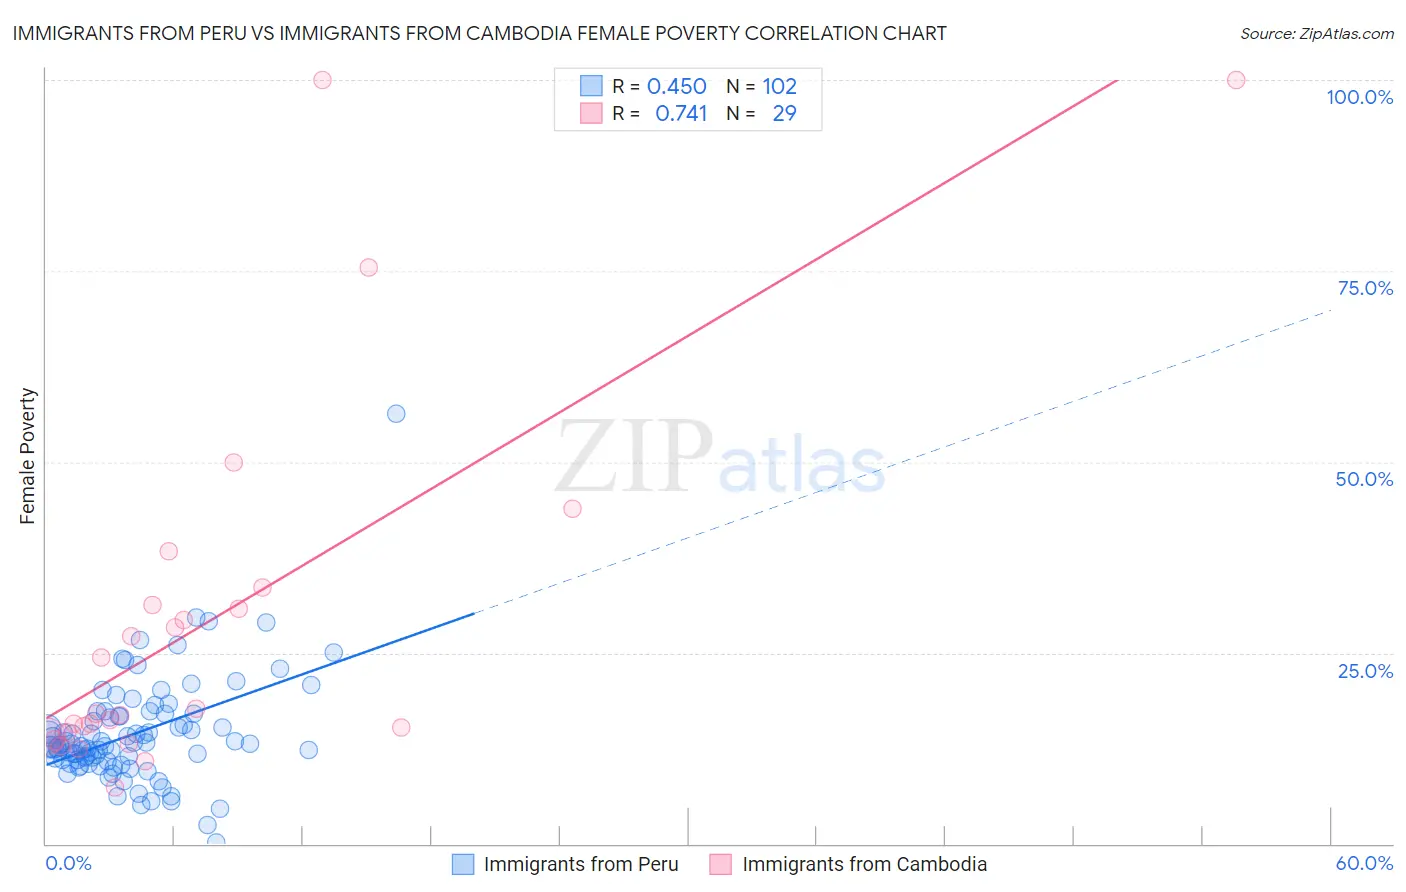
Immigrants from Peru vs Immigrants from Cambodia Female Poverty Correlation Chart
The statistical analysis conducted on geographies consisting of 328,728,905 people shows a moderate positive correlation between the proportion of Immigrants from Peru and poverty level among females in the United States with a correlation coefficient (R) of 0.450 and weighted average of 13.0%. Similarly, the statistical analysis conducted on geographies consisting of 205,118,115 people shows a strong positive correlation between the proportion of Immigrants from Cambodia and poverty level among females in the United States with a correlation coefficient (R) of 0.741 and weighted average of 14.5%, a difference of 11.4%.
Female Poverty Correlation Summary
| Measurement | Immigrants from Peru | Immigrants from Cambodia |
| Minimum | 0.21% | 7.4% |
| Maximum | 56.3% | 100.0% |
| Range | 56.1% | 92.6% |
| Mean | 14.4% | 29.0% |
| Median | 12.8% | 17.1% |
| Interquartile 25% (IQ1) | 11.0% | 14.3% |
| Interquartile 75% (IQ3) | 16.7% | 32.4% |
| Interquartile Range (IQR) | 5.7% | 18.0% |
| Standard Deviation (Sample) | 7.0% | 24.4% |
| Standard Deviation (Population) | 7.0% | 23.9% |
Similar Demographics by Female Poverty
Demographics Similar to Immigrants from Peru by Female Poverty
In terms of female poverty, the demographic groups most similar to Immigrants from Peru are Syrian (13.0%, a difference of 0.080%), Immigrants from Kazakhstan (13.0%, a difference of 0.080%), Afghan (13.0%, a difference of 0.11%), Immigrants from Malaysia (13.0%, a difference of 0.19%), and Brazilian (13.0%, a difference of 0.22%).
| Demographics | Rating | Rank | Female Poverty |
| Basques | 83.1 /100 | #139 | Excellent 12.9% |
| Pakistanis | 83.0 /100 | #140 | Excellent 12.9% |
| Icelanders | 81.1 /100 | #141 | Excellent 13.0% |
| Brazilians | 80.5 /100 | #142 | Excellent 13.0% |
| Immigrants | Malaysia | 80.4 /100 | #143 | Excellent 13.0% |
| Afghans | 79.8 /100 | #144 | Good 13.0% |
| Syrians | 79.6 /100 | #145 | Good 13.0% |
| Immigrants | Peru | 79.1 /100 | #146 | Good 13.0% |
| Immigrants | Kazakhstan | 78.6 /100 | #147 | Good 13.0% |
| Yugoslavians | 76.9 /100 | #148 | Good 13.1% |
| Taiwanese | 75.7 /100 | #149 | Good 13.1% |
| Tsimshian | 75.5 /100 | #150 | Good 13.1% |
| Immigrants | Germany | 74.9 /100 | #151 | Good 13.1% |
| Samoans | 73.6 /100 | #152 | Good 13.1% |
| Immigrants | Fiji | 71.0 /100 | #153 | Good 13.2% |
Demographics Similar to Immigrants from Cambodia by Female Poverty
In terms of female poverty, the demographic groups most similar to Immigrants from Cambodia are Nonimmigrants (14.5%, a difference of 0.020%), Alsatian (14.5%, a difference of 0.19%), Japanese (14.5%, a difference of 0.24%), Immigrants from Africa (14.5%, a difference of 0.26%), and Immigrants from Uzbekistan (14.4%, a difference of 0.38%).
| Demographics | Rating | Rank | Female Poverty |
| Marshallese | 5.0 /100 | #214 | Tragic 14.4% |
| Immigrants | Panama | 4.7 /100 | #215 | Tragic 14.4% |
| Immigrants | Thailand | 4.5 /100 | #216 | Tragic 14.4% |
| Immigrants | Immigrants | 4.5 /100 | #217 | Tragic 14.4% |
| Immigrants | Uzbekistan | 4.4 /100 | #218 | Tragic 14.4% |
| Japanese | 4.1 /100 | #219 | Tragic 14.5% |
| Alsatians | 4.0 /100 | #220 | Tragic 14.5% |
| Immigrants | Cambodia | 3.7 /100 | #221 | Tragic 14.5% |
| Immigrants | Nonimmigrants | 3.7 /100 | #222 | Tragic 14.5% |
| Immigrants | Africa | 3.3 /100 | #223 | Tragic 14.5% |
| Americans | 2.8 /100 | #224 | Tragic 14.6% |
| Immigrants | Micronesia | 2.8 /100 | #225 | Tragic 14.6% |
| Immigrants | Eritrea | 2.4 /100 | #226 | Tragic 14.6% |
| Immigrants | Nigeria | 2.1 /100 | #227 | Tragic 14.7% |
| German Russians | 2.0 /100 | #228 | Tragic 14.7% |