Immigrants from Peru vs Immigrants from Ecuador Female Poverty
COMPARE
Immigrants from Peru
Immigrants from Ecuador
Female Poverty
Female Poverty Comparison
Immigrants from Peru
Immigrants from Ecuador
13.0%
FEMALE POVERTY
79.1/ 100
METRIC RATING
146th/ 347
METRIC RANK
15.6%
FEMALE POVERTY
0.1/ 100
METRIC RATING
264th/ 347
METRIC RANK
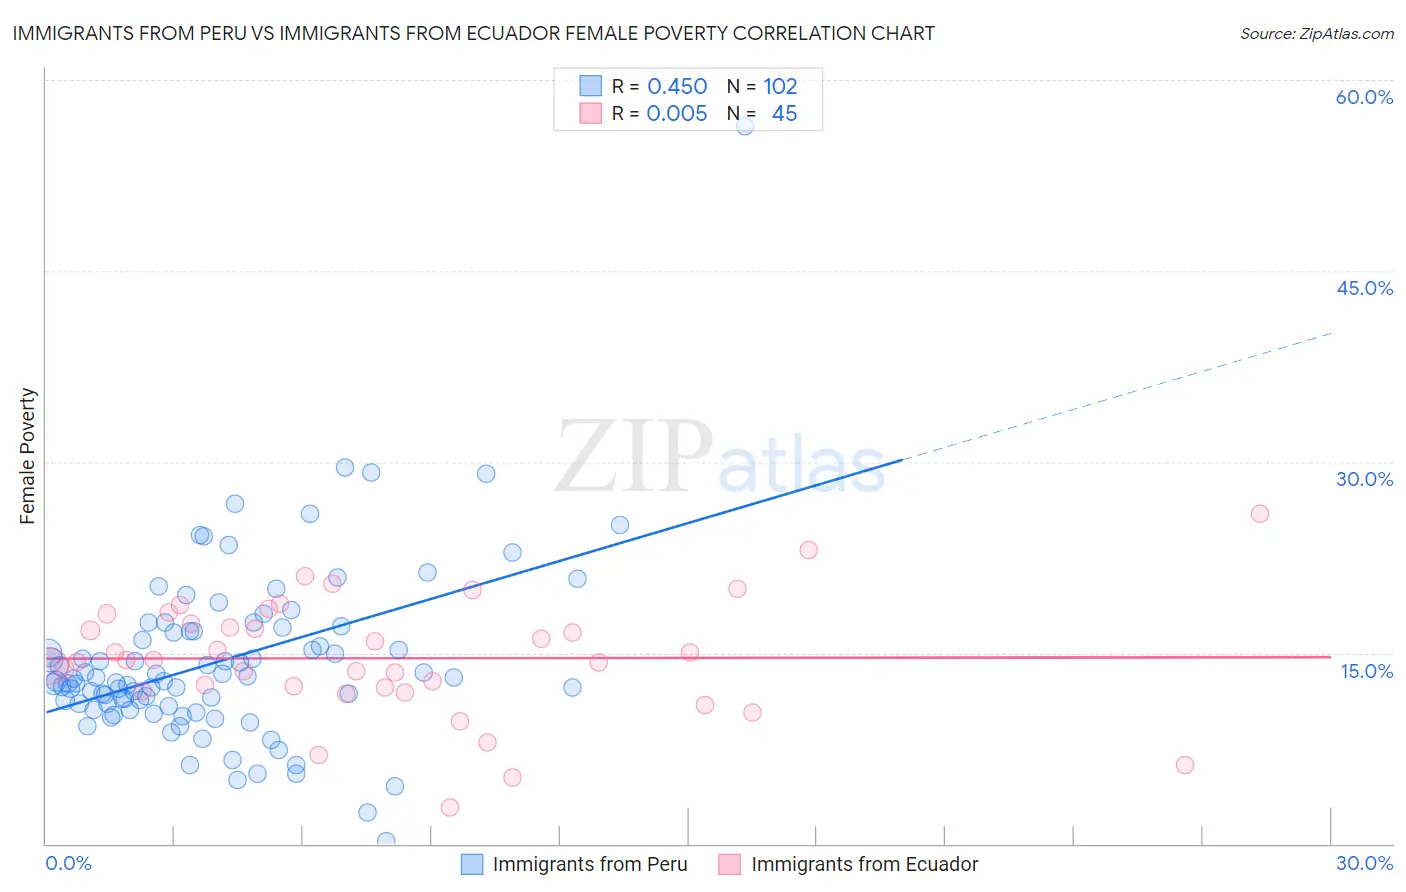
Immigrants from Peru vs Immigrants from Ecuador Female Poverty Correlation Chart
The statistical analysis conducted on geographies consisting of 328,728,905 people shows a moderate positive correlation between the proportion of Immigrants from Peru and poverty level among females in the United States with a correlation coefficient (R) of 0.450 and weighted average of 13.0%. Similarly, the statistical analysis conducted on geographies consisting of 270,847,702 people shows no correlation between the proportion of Immigrants from Ecuador and poverty level among females in the United States with a correlation coefficient (R) of 0.005 and weighted average of 15.6%, a difference of 20.1%.
Female Poverty Correlation Summary
| Measurement | Immigrants from Peru | Immigrants from Ecuador |
| Minimum | 0.21% | 2.8% |
| Maximum | 56.3% | 25.9% |
| Range | 56.1% | 23.1% |
| Mean | 14.4% | 14.6% |
| Median | 12.8% | 14.4% |
| Interquartile 25% (IQ1) | 11.0% | 12.2% |
| Interquartile 75% (IQ3) | 16.7% | 17.7% |
| Interquartile Range (IQR) | 5.7% | 5.5% |
| Standard Deviation (Sample) | 7.0% | 4.6% |
| Standard Deviation (Population) | 7.0% | 4.6% |
Similar Demographics by Female Poverty
Demographics Similar to Immigrants from Peru by Female Poverty
In terms of female poverty, the demographic groups most similar to Immigrants from Peru are Syrian (13.0%, a difference of 0.080%), Immigrants from Kazakhstan (13.0%, a difference of 0.080%), Afghan (13.0%, a difference of 0.11%), Immigrants from Malaysia (13.0%, a difference of 0.19%), and Brazilian (13.0%, a difference of 0.22%).
| Demographics | Rating | Rank | Female Poverty |
| Basques | 83.1 /100 | #139 | Excellent 12.9% |
| Pakistanis | 83.0 /100 | #140 | Excellent 12.9% |
| Icelanders | 81.1 /100 | #141 | Excellent 13.0% |
| Brazilians | 80.5 /100 | #142 | Excellent 13.0% |
| Immigrants | Malaysia | 80.4 /100 | #143 | Excellent 13.0% |
| Afghans | 79.8 /100 | #144 | Good 13.0% |
| Syrians | 79.6 /100 | #145 | Good 13.0% |
| Immigrants | Peru | 79.1 /100 | #146 | Good 13.0% |
| Immigrants | Kazakhstan | 78.6 /100 | #147 | Good 13.0% |
| Yugoslavians | 76.9 /100 | #148 | Good 13.1% |
| Taiwanese | 75.7 /100 | #149 | Good 13.1% |
| Tsimshian | 75.5 /100 | #150 | Good 13.1% |
| Immigrants | Germany | 74.9 /100 | #151 | Good 13.1% |
| Samoans | 73.6 /100 | #152 | Good 13.1% |
| Immigrants | Fiji | 71.0 /100 | #153 | Good 13.2% |
Demographics Similar to Immigrants from Ecuador by Female Poverty
In terms of female poverty, the demographic groups most similar to Immigrants from Ecuador are Cherokee (15.6%, a difference of 0.13%), Guyanese (15.6%, a difference of 0.14%), Mexican American Indian (15.6%, a difference of 0.14%), Immigrants from Guyana (15.6%, a difference of 0.24%), and Immigrants from Liberia (15.7%, a difference of 0.30%).
| Demographics | Rating | Rank | Female Poverty |
| Immigrants | Jamaica | 0.1 /100 | #257 | Tragic 15.6% |
| Shoshone | 0.1 /100 | #258 | Tragic 15.6% |
| Cape Verdeans | 0.1 /100 | #259 | Tragic 15.6% |
| Immigrants | Guyana | 0.1 /100 | #260 | Tragic 15.6% |
| Guyanese | 0.1 /100 | #261 | Tragic 15.6% |
| Mexican American Indians | 0.1 /100 | #262 | Tragic 15.6% |
| Cherokee | 0.1 /100 | #263 | Tragic 15.6% |
| Immigrants | Ecuador | 0.1 /100 | #264 | Tragic 15.6% |
| Immigrants | Liberia | 0.1 /100 | #265 | Tragic 15.7% |
| Immigrants | El Salvador | 0.1 /100 | #266 | Tragic 15.7% |
| Sub-Saharan Africans | 0.1 /100 | #267 | Tragic 15.8% |
| Immigrants | Nicaragua | 0.1 /100 | #268 | Tragic 15.8% |
| Iroquois | 0.1 /100 | #269 | Tragic 15.8% |
| Chickasaw | 0.1 /100 | #270 | Tragic 15.9% |
| Immigrants | St. Vincent and the Grenadines | 0.0 /100 | #271 | Tragic 15.9% |