Immigrants from Peru vs Immigrants from Turkey Female Poverty
COMPARE
Immigrants from Peru
Immigrants from Turkey
Female Poverty
Female Poverty Comparison
Immigrants from Peru
Immigrants from Turkey
13.0%
FEMALE POVERTY
79.1/ 100
METRIC RATING
146th/ 347
METRIC RANK
12.6%
FEMALE POVERTY
93.8/ 100
METRIC RATING
106th/ 347
METRIC RANK
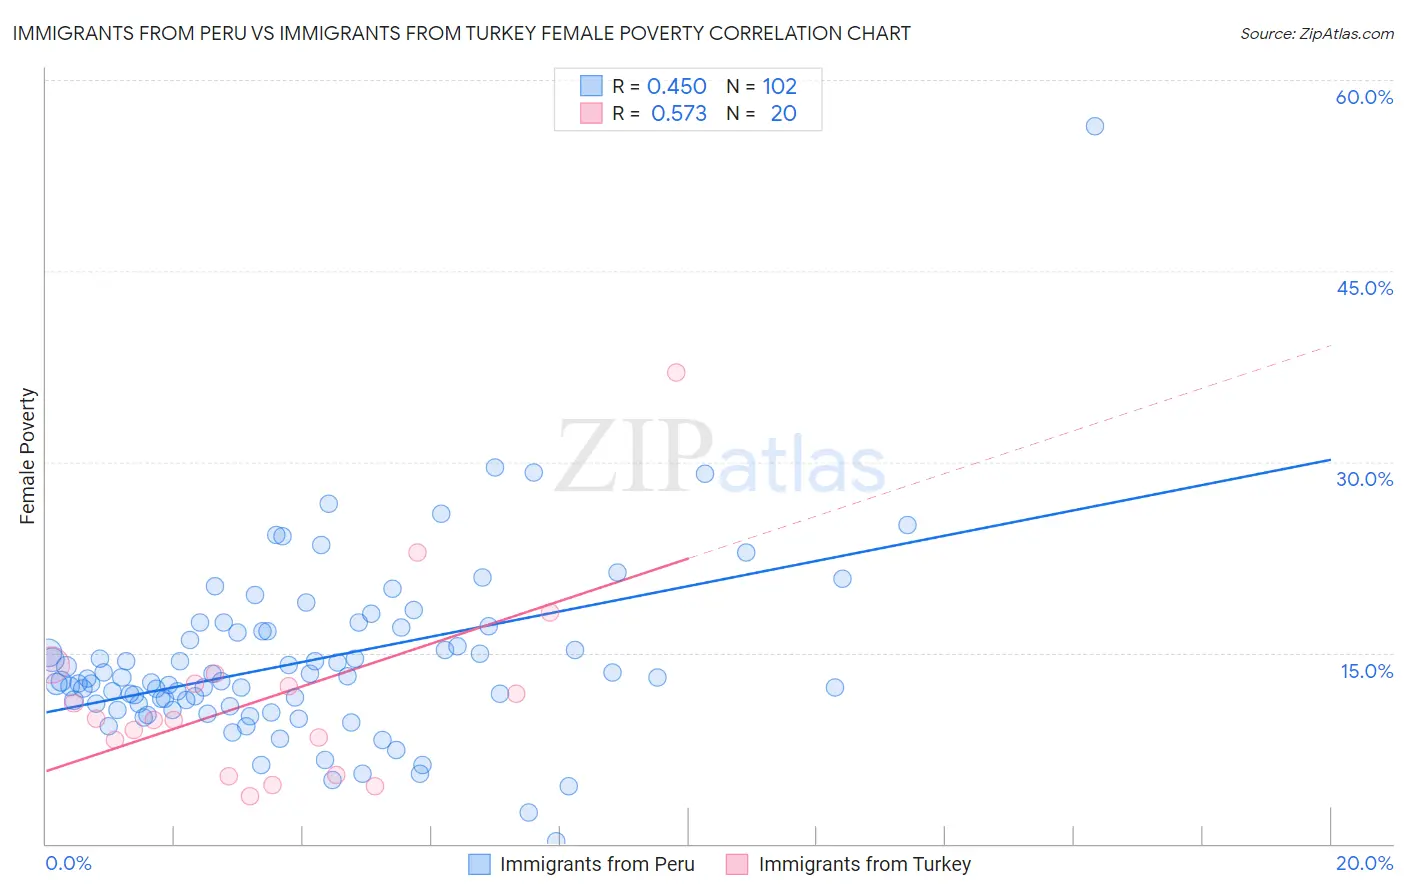
Immigrants from Peru vs Immigrants from Turkey Female Poverty Correlation Chart
The statistical analysis conducted on geographies consisting of 328,728,905 people shows a moderate positive correlation between the proportion of Immigrants from Peru and poverty level among females in the United States with a correlation coefficient (R) of 0.450 and weighted average of 13.0%. Similarly, the statistical analysis conducted on geographies consisting of 222,940,623 people shows a substantial positive correlation between the proportion of Immigrants from Turkey and poverty level among females in the United States with a correlation coefficient (R) of 0.573 and weighted average of 12.6%, a difference of 3.6%.
Female Poverty Correlation Summary
| Measurement | Immigrants from Peru | Immigrants from Turkey |
| Minimum | 0.21% | 3.7% |
| Maximum | 56.3% | 37.0% |
| Range | 56.1% | 33.3% |
| Mean | 14.4% | 11.6% |
| Median | 12.8% | 9.8% |
| Interquartile 25% (IQ1) | 11.0% | 6.7% |
| Interquartile 75% (IQ3) | 16.7% | 13.0% |
| Interquartile Range (IQR) | 5.7% | 6.2% |
| Standard Deviation (Sample) | 7.0% | 7.6% |
| Standard Deviation (Population) | 7.0% | 7.4% |
Similar Demographics by Female Poverty
Demographics Similar to Immigrants from Peru by Female Poverty
In terms of female poverty, the demographic groups most similar to Immigrants from Peru are Syrian (13.0%, a difference of 0.080%), Immigrants from Kazakhstan (13.0%, a difference of 0.080%), Afghan (13.0%, a difference of 0.11%), Immigrants from Malaysia (13.0%, a difference of 0.19%), and Brazilian (13.0%, a difference of 0.22%).
| Demographics | Rating | Rank | Female Poverty |
| Basques | 83.1 /100 | #139 | Excellent 12.9% |
| Pakistanis | 83.0 /100 | #140 | Excellent 12.9% |
| Icelanders | 81.1 /100 | #141 | Excellent 13.0% |
| Brazilians | 80.5 /100 | #142 | Excellent 13.0% |
| Immigrants | Malaysia | 80.4 /100 | #143 | Excellent 13.0% |
| Afghans | 79.8 /100 | #144 | Good 13.0% |
| Syrians | 79.6 /100 | #145 | Good 13.0% |
| Immigrants | Peru | 79.1 /100 | #146 | Good 13.0% |
| Immigrants | Kazakhstan | 78.6 /100 | #147 | Good 13.0% |
| Yugoslavians | 76.9 /100 | #148 | Good 13.1% |
| Taiwanese | 75.7 /100 | #149 | Good 13.1% |
| Tsimshian | 75.5 /100 | #150 | Good 13.1% |
| Immigrants | Germany | 74.9 /100 | #151 | Good 13.1% |
| Samoans | 73.6 /100 | #152 | Good 13.1% |
| Immigrants | Fiji | 71.0 /100 | #153 | Good 13.2% |
Demographics Similar to Immigrants from Turkey by Female Poverty
In terms of female poverty, the demographic groups most similar to Immigrants from Turkey are Scottish (12.5%, a difference of 0.12%), Laotian (12.6%, a difference of 0.19%), Palestinian (12.5%, a difference of 0.23%), Portuguese (12.6%, a difference of 0.29%), and Immigrants from Zimbabwe (12.6%, a difference of 0.31%).
| Demographics | Rating | Rank | Female Poverty |
| Romanians | 95.1 /100 | #99 | Exceptional 12.5% |
| Immigrants | Latvia | 94.8 /100 | #100 | Exceptional 12.5% |
| Tlingit-Haida | 94.8 /100 | #101 | Exceptional 12.5% |
| Immigrants | China | 94.5 /100 | #102 | Exceptional 12.5% |
| Slavs | 94.5 /100 | #103 | Exceptional 12.5% |
| Palestinians | 94.3 /100 | #104 | Exceptional 12.5% |
| Scottish | 94.1 /100 | #105 | Exceptional 12.5% |
| Immigrants | Turkey | 93.8 /100 | #106 | Exceptional 12.6% |
| Laotians | 93.4 /100 | #107 | Exceptional 12.6% |
| Portuguese | 93.1 /100 | #108 | Exceptional 12.6% |
| Immigrants | Zimbabwe | 93.1 /100 | #109 | Exceptional 12.6% |
| Paraguayans | 93.0 /100 | #110 | Exceptional 12.6% |
| Soviet Union | 92.4 /100 | #111 | Exceptional 12.6% |
| Immigrants | Israel | 92.0 /100 | #112 | Exceptional 12.6% |
| Canadians | 92.0 /100 | #113 | Exceptional 12.7% |