Black/African American vs Hopi Female Poverty
COMPARE
Black/African American
Hopi
Female Poverty
Female Poverty Comparison
Blacks/African Americans
Hopi
18.6%
FEMALE POVERTY
0.0/ 100
METRIC RATING
328th/ 347
METRIC RANK
21.0%
FEMALE POVERTY
0.0/ 100
METRIC RATING
339th/ 347
METRIC RANK
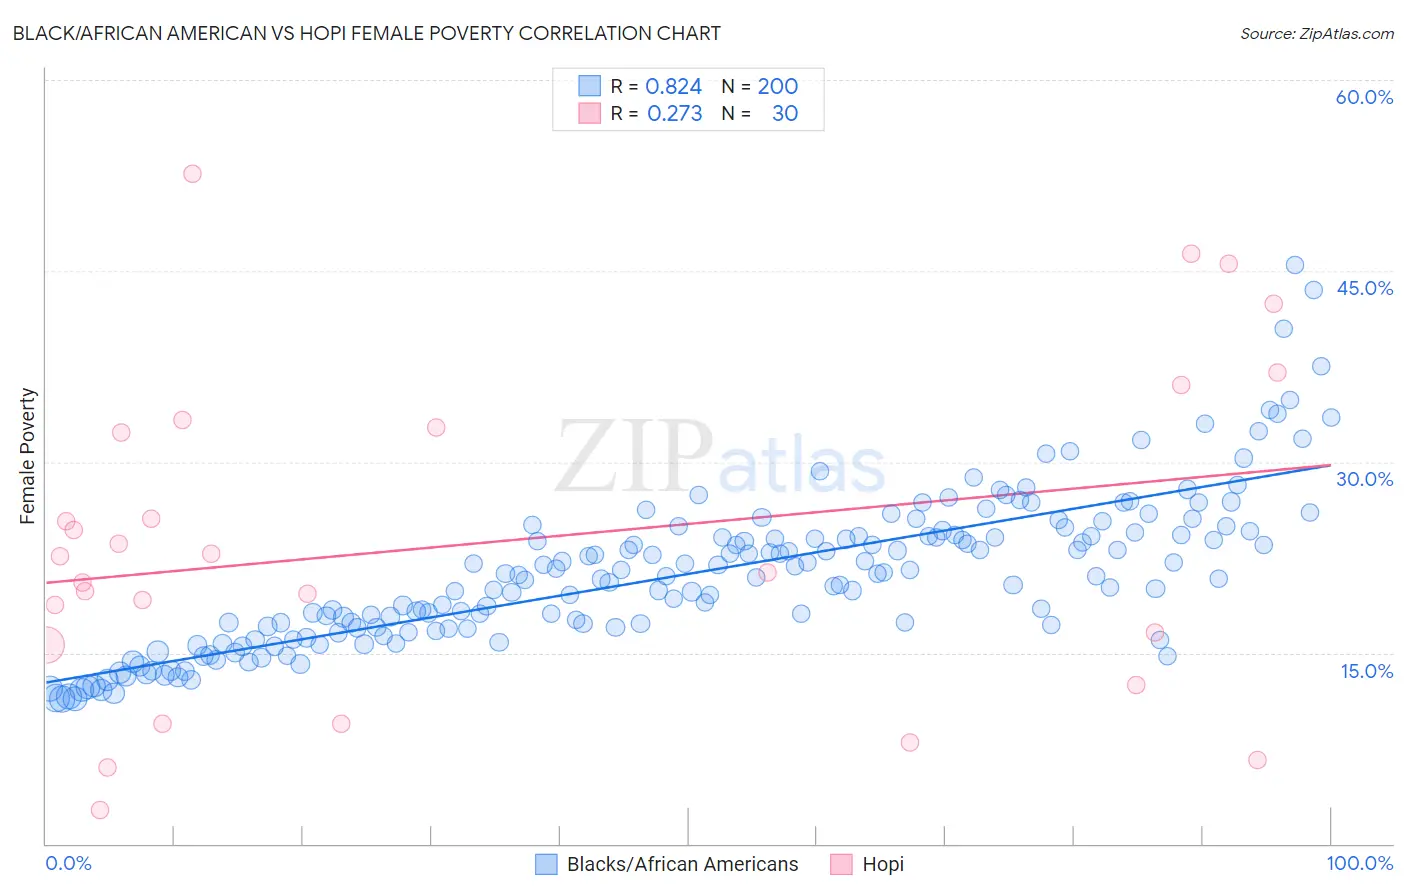
Black/African American vs Hopi Female Poverty Correlation Chart
The statistical analysis conducted on geographies consisting of 564,914,608 people shows a very strong positive correlation between the proportion of Blacks/African Americans and poverty level among females in the United States with a correlation coefficient (R) of 0.824 and weighted average of 18.6%. Similarly, the statistical analysis conducted on geographies consisting of 74,730,236 people shows a weak positive correlation between the proportion of Hopi and poverty level among females in the United States with a correlation coefficient (R) of 0.273 and weighted average of 21.0%, a difference of 12.8%.
Female Poverty Correlation Summary
| Measurement | Black/African American | Hopi |
| Minimum | 11.4% | 2.6% |
| Maximum | 45.5% | 52.7% |
| Range | 34.1% | 50.0% |
| Mean | 21.2% | 23.6% |
| Median | 21.0% | 22.0% |
| Interquartile 25% (IQ1) | 16.9% | 15.6% |
| Interquartile 75% (IQ3) | 24.2% | 32.7% |
| Interquartile Range (IQR) | 7.3% | 17.1% |
| Standard Deviation (Sample) | 6.0% | 12.9% |
| Standard Deviation (Population) | 6.0% | 12.7% |
Demographics Similar to Blacks/African Americans and Hopi by Female Poverty
In terms of female poverty, the demographic groups most similar to Blacks/African Americans are Kiowa (18.6%, a difference of 0.12%), Dominican (19.1%, a difference of 2.9%), Yakama (18.0%, a difference of 3.0%), Central American Indian (18.0%, a difference of 3.1%), and Native/Alaskan (19.2%, a difference of 3.3%). Similarly, the demographic groups most similar to Hopi are Sioux (20.9%, a difference of 0.37%), Yuman (20.8%, a difference of 0.56%), Pueblo (20.7%, a difference of 1.4%), Yup'ik (21.5%, a difference of 2.5%), and Cheyenne (20.2%, a difference of 3.8%).
| Demographics | Rating | Rank | Female Poverty |
| Paiute | 0.0 /100 | #323 | Tragic 17.7% |
| Immigrants | Honduras | 0.0 /100 | #324 | Tragic 17.7% |
| Colville | 0.0 /100 | #325 | Tragic 17.8% |
| Central American Indians | 0.0 /100 | #326 | Tragic 18.0% |
| Yakama | 0.0 /100 | #327 | Tragic 18.0% |
| Blacks/African Americans | 0.0 /100 | #328 | Tragic 18.6% |
| Kiowa | 0.0 /100 | #329 | Tragic 18.6% |
| Dominicans | 0.0 /100 | #330 | Tragic 19.1% |
| Natives/Alaskans | 0.0 /100 | #331 | Tragic 19.2% |
| Apache | 0.0 /100 | #332 | Tragic 19.2% |
| Immigrants | Dominican Republic | 0.0 /100 | #333 | Tragic 19.3% |
| Houma | 0.0 /100 | #334 | Tragic 20.0% |
| Cheyenne | 0.0 /100 | #335 | Tragic 20.2% |
| Pueblo | 0.0 /100 | #336 | Tragic 20.7% |
| Yuman | 0.0 /100 | #337 | Tragic 20.8% |
| Sioux | 0.0 /100 | #338 | Tragic 20.9% |
| Hopi | 0.0 /100 | #339 | Tragic 21.0% |
| Yup'ik | 0.0 /100 | #340 | Tragic 21.5% |
| Crow | 0.0 /100 | #341 | Tragic 22.1% |
| Immigrants | Yemen | 0.0 /100 | #342 | Tragic 22.8% |
| Lumbee | 0.0 /100 | #343 | Tragic 23.5% |