Immigrants from Peru vs Immigrants from Singapore Female Poverty
COMPARE
Immigrants from Peru
Immigrants from Singapore
Female Poverty
Female Poverty Comparison
Immigrants from Peru
Immigrants from Singapore
13.0%
FEMALE POVERTY
79.1/ 100
METRIC RATING
146th/ 347
METRIC RANK
11.8%
FEMALE POVERTY
99.4/ 100
METRIC RATING
34th/ 347
METRIC RANK
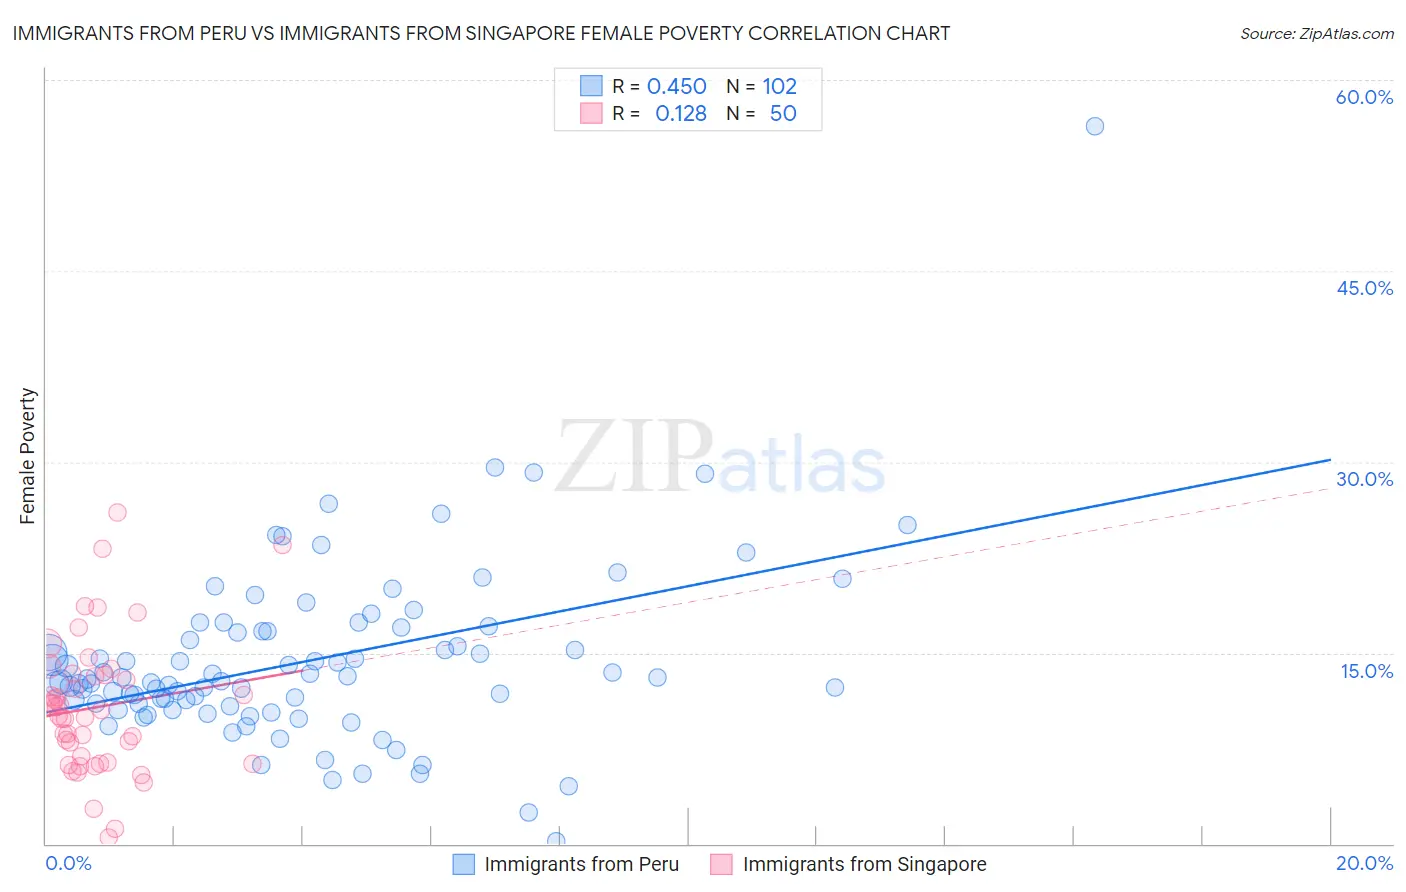
Immigrants from Peru vs Immigrants from Singapore Female Poverty Correlation Chart
The statistical analysis conducted on geographies consisting of 328,728,905 people shows a moderate positive correlation between the proportion of Immigrants from Peru and poverty level among females in the United States with a correlation coefficient (R) of 0.450 and weighted average of 13.0%. Similarly, the statistical analysis conducted on geographies consisting of 137,378,092 people shows a poor positive correlation between the proportion of Immigrants from Singapore and poverty level among females in the United States with a correlation coefficient (R) of 0.128 and weighted average of 11.8%, a difference of 10.6%.
Female Poverty Correlation Summary
| Measurement | Immigrants from Peru | Immigrants from Singapore |
| Minimum | 0.21% | 0.53% |
| Maximum | 56.3% | 26.0% |
| Range | 56.1% | 25.5% |
| Mean | 14.4% | 10.7% |
| Median | 12.8% | 10.3% |
| Interquartile 25% (IQ1) | 11.0% | 6.4% |
| Interquartile 75% (IQ3) | 16.7% | 13.2% |
| Interquartile Range (IQR) | 5.7% | 6.9% |
| Standard Deviation (Sample) | 7.0% | 5.4% |
| Standard Deviation (Population) | 7.0% | 5.3% |
Similar Demographics by Female Poverty
Demographics Similar to Immigrants from Peru by Female Poverty
In terms of female poverty, the demographic groups most similar to Immigrants from Peru are Syrian (13.0%, a difference of 0.080%), Immigrants from Kazakhstan (13.0%, a difference of 0.080%), Afghan (13.0%, a difference of 0.11%), Immigrants from Malaysia (13.0%, a difference of 0.19%), and Brazilian (13.0%, a difference of 0.22%).
| Demographics | Rating | Rank | Female Poverty |
| Basques | 83.1 /100 | #139 | Excellent 12.9% |
| Pakistanis | 83.0 /100 | #140 | Excellent 12.9% |
| Icelanders | 81.1 /100 | #141 | Excellent 13.0% |
| Brazilians | 80.5 /100 | #142 | Excellent 13.0% |
| Immigrants | Malaysia | 80.4 /100 | #143 | Excellent 13.0% |
| Afghans | 79.8 /100 | #144 | Good 13.0% |
| Syrians | 79.6 /100 | #145 | Good 13.0% |
| Immigrants | Peru | 79.1 /100 | #146 | Good 13.0% |
| Immigrants | Kazakhstan | 78.6 /100 | #147 | Good 13.0% |
| Yugoslavians | 76.9 /100 | #148 | Good 13.1% |
| Taiwanese | 75.7 /100 | #149 | Good 13.1% |
| Tsimshian | 75.5 /100 | #150 | Good 13.1% |
| Immigrants | Germany | 74.9 /100 | #151 | Good 13.1% |
| Samoans | 73.6 /100 | #152 | Good 13.1% |
| Immigrants | Fiji | 71.0 /100 | #153 | Good 13.2% |
Demographics Similar to Immigrants from Singapore by Female Poverty
In terms of female poverty, the demographic groups most similar to Immigrants from Singapore are Cypriot (11.8%, a difference of 0.12%), Immigrants from Iran (11.8%, a difference of 0.17%), Danish (11.7%, a difference of 0.19%), Polish (11.7%, a difference of 0.32%), and Immigrants from Pakistan (11.8%, a difference of 0.34%).
| Demographics | Rating | Rank | Female Poverty |
| Iranians | 99.6 /100 | #27 | Exceptional 11.7% |
| Immigrants | Korea | 99.6 /100 | #28 | Exceptional 11.7% |
| Immigrants | North Macedonia | 99.6 /100 | #29 | Exceptional 11.7% |
| Greeks | 99.5 /100 | #30 | Exceptional 11.7% |
| Poles | 99.5 /100 | #31 | Exceptional 11.7% |
| Danes | 99.5 /100 | #32 | Exceptional 11.7% |
| Cypriots | 99.5 /100 | #33 | Exceptional 11.8% |
| Immigrants | Singapore | 99.4 /100 | #34 | Exceptional 11.8% |
| Immigrants | Iran | 99.4 /100 | #35 | Exceptional 11.8% |
| Immigrants | Pakistan | 99.4 /100 | #36 | Exceptional 11.8% |
| Immigrants | Greece | 99.3 /100 | #37 | Exceptional 11.8% |
| Russians | 99.3 /100 | #38 | Exceptional 11.8% |
| Immigrants | Poland | 99.3 /100 | #39 | Exceptional 11.8% |
| Macedonians | 99.3 /100 | #40 | Exceptional 11.8% |
| Czechs | 99.2 /100 | #41 | Exceptional 11.9% |