Immigrants from Northern Europe vs African Poverty
COMPARE
Immigrants from Northern Europe
African
Poverty
Poverty Comparison
Immigrants from Northern Europe
Africans
10.7%
POVERTY
99.6/ 100
METRIC RATING
27th/ 347
METRIC RANK
15.6%
POVERTY
0.0/ 100
METRIC RATING
307th/ 347
METRIC RANK
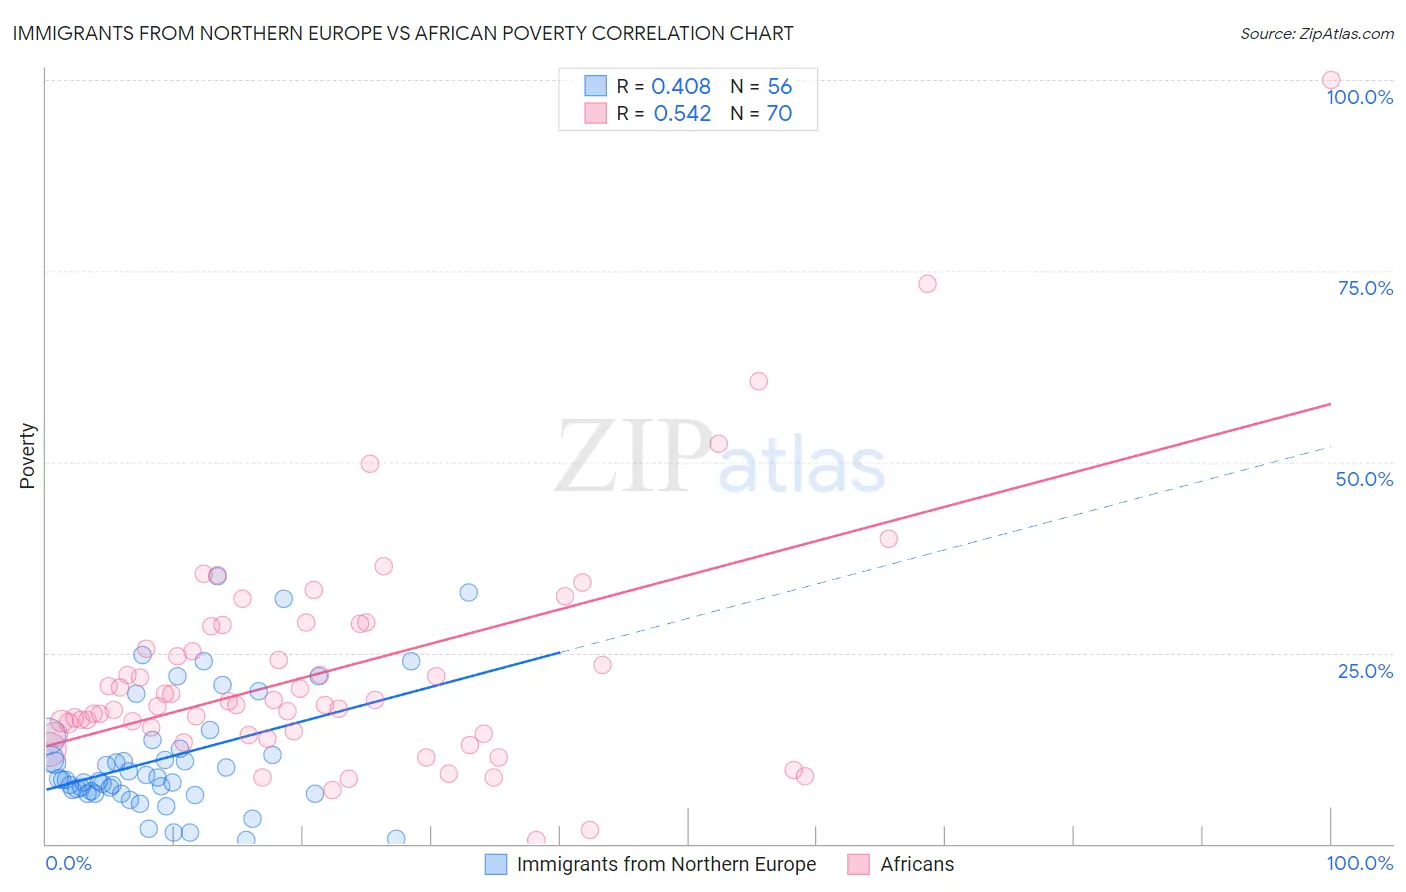
Immigrants from Northern Europe vs African Poverty Correlation Chart
The statistical analysis conducted on geographies consisting of 476,900,751 people shows a moderate positive correlation between the proportion of Immigrants from Northern Europe and poverty level in the United States with a correlation coefficient (R) of 0.408 and weighted average of 10.7%. Similarly, the statistical analysis conducted on geographies consisting of 469,617,855 people shows a substantial positive correlation between the proportion of Africans and poverty level in the United States with a correlation coefficient (R) of 0.542 and weighted average of 15.6%, a difference of 45.6%.
Poverty Correlation Summary
| Measurement | Immigrants from Northern Europe | African |
| Minimum | 0.52% | 0.57% |
| Maximum | 35.0% | 100.0% |
| Range | 34.5% | 99.4% |
| Mean | 11.2% | 22.7% |
| Median | 8.5% | 18.4% |
| Interquartile 25% (IQ1) | 6.7% | 14.4% |
| Interquartile 75% (IQ3) | 13.0% | 28.5% |
| Interquartile Range (IQR) | 6.3% | 14.0% |
| Standard Deviation (Sample) | 7.9% | 15.6% |
| Standard Deviation (Population) | 7.9% | 15.5% |
Similar Demographics by Poverty
Demographics Similar to Immigrants from Northern Europe by Poverty
In terms of poverty, the demographic groups most similar to Immigrants from Northern Europe are Immigrants from Korea (10.7%, a difference of 0.070%), Greek (10.7%, a difference of 0.16%), Danish (10.7%, a difference of 0.17%), Polish (10.7%, a difference of 0.25%), and Iranian (10.7%, a difference of 0.34%).
| Demographics | Rating | Rank | Poverty |
| Immigrants | North Macedonia | 99.7 /100 | #20 | Exceptional 10.6% |
| Luxembourgers | 99.7 /100 | #21 | Exceptional 10.6% |
| Eastern Europeans | 99.7 /100 | #22 | Exceptional 10.6% |
| Swedes | 99.7 /100 | #23 | Exceptional 10.6% |
| Italians | 99.7 /100 | #24 | Exceptional 10.6% |
| Croatians | 99.6 /100 | #25 | Exceptional 10.6% |
| Burmese | 99.6 /100 | #26 | Exceptional 10.7% |
| Immigrants | Northern Europe | 99.6 /100 | #27 | Exceptional 10.7% |
| Immigrants | Korea | 99.5 /100 | #28 | Exceptional 10.7% |
| Greeks | 99.5 /100 | #29 | Exceptional 10.7% |
| Danes | 99.5 /100 | #30 | Exceptional 10.7% |
| Poles | 99.5 /100 | #31 | Exceptional 10.7% |
| Iranians | 99.5 /100 | #32 | Exceptional 10.7% |
| Macedonians | 99.4 /100 | #33 | Exceptional 10.8% |
| Immigrants | Poland | 99.4 /100 | #34 | Exceptional 10.8% |
Demographics Similar to Africans by Poverty
In terms of poverty, the demographic groups most similar to Africans are Creek (15.6%, a difference of 0.070%), Choctaw (15.6%, a difference of 0.11%), Seminole (15.6%, a difference of 0.15%), Dutch West Indian (15.6%, a difference of 0.24%), and Immigrants from Guatemala (15.5%, a difference of 0.51%).
| Demographics | Rating | Rank | Poverty |
| Immigrants | Central America | 0.0 /100 | #300 | Tragic 15.4% |
| Bahamians | 0.0 /100 | #301 | Tragic 15.4% |
| Somalis | 0.0 /100 | #302 | Tragic 15.4% |
| Immigrants | Caribbean | 0.0 /100 | #303 | Tragic 15.5% |
| Immigrants | Mexico | 0.0 /100 | #304 | Tragic 15.5% |
| Immigrants | Guatemala | 0.0 /100 | #305 | Tragic 15.5% |
| Creek | 0.0 /100 | #306 | Tragic 15.6% |
| Africans | 0.0 /100 | #307 | Tragic 15.6% |
| Choctaw | 0.0 /100 | #308 | Tragic 15.6% |
| Seminole | 0.0 /100 | #309 | Tragic 15.6% |
| Dutch West Indians | 0.0 /100 | #310 | Tragic 15.6% |
| Chippewa | 0.0 /100 | #311 | Tragic 15.7% |
| Cajuns | 0.0 /100 | #312 | Tragic 15.7% |
| Immigrants | Grenada | 0.0 /100 | #313 | Tragic 15.8% |
| Immigrants | Somalia | 0.0 /100 | #314 | Tragic 15.8% |