Immigrants from Turkey vs African Poverty

COMPARE

Immigrants from Turkey
Race
Ancestry
AfghanAlaska NativeAlaskan AthabascanAlbanianAleutAlsatianAmericanApacheArabArapahoArgentineanArmenianAssyrian/Chaldean/SyriacAustralianAustrianBahamianBangladeshiBarbadianBasqueBelgianBelizeanBermudanBhutaneseBlackfeetBolivianBrazilianBritishBritish West IndianBulgarianBurmeseCajunCambodianCanadianCape VerdeanCarpatho RusynCelticCentral AmericanCentral American IndianCherokeeCheyenneChickasawChileanChineseChippewaChoctawColombianColvilleComancheCosta RicanCreeCreekCroatianCrowCubanCypriotCzechCzechoslovakianDanishDelawareDominicanDutchDutch West IndianEastern EuropeanEcuadorianEgyptianEnglishEstonianEthiopianEuropeanFijianFilipinoFinnishFrenchFrench American IndianFrench CanadianGermanGerman RussianGhanaianGreekGuamanian/ChamorroGuatemalanGuyaneseHaitianHmongHonduranHopiHoumaHungarianIcelanderIndian (Asian)IndonesianInupiatIranianIraqiIrishIroquoisIsraeliItalianJamaicanJapaneseJordanianKenyanKiowaKoreanLaotianLatvianLebaneseLiberianLithuanianLumbeeLuxembourgerMacedonianMalaysianMalteseMarshalleseMenomineeMexicanMexican American IndianMongolianMoroccanNative HawaiianNavajoNepaleseNew ZealanderNicaraguanNigerianNorthern EuropeanNorwegianOkinawanOsageOttawaPaiutePakistaniPalestinianPanamanianParaguayanPennsylvania GermanPeruvianPimaPolishPortuguesePotawatomiPuebloPuerto RicanPuget Sound SalishRomanianRussianSalvadoranSamoanScandinavianScotch-IrishScottishSeminoleSenegaleseSerbianShoshoneSierra LeoneanSiouxSlavicSlovakSloveneSomaliSouth AfricanSouth AmericanSouth American IndianSoviet UnionSpaniardSpanishSpanish AmericanSpanish American IndianSri LankanSubsaharan AfricanSudaneseSwedishSwissSyrianTaiwaneseThaiTlingit-HaidaTohono O'OdhamTonganTrinidadian and TobagonianTsimshianTurkishU.S. Virgin IslanderUgandanUkrainianUruguayanUteVenezuelanVietnameseWelshWest IndianYakamaYaquiYugoslavianYumanYup'ikZimbabwean
Immigration
NonimmigrantsImmigrantsAfghanistanAfricaAlbaniaArgentinaArmeniaAsiaAustraliaAustriaBahamasBangladeshBarbadosBelarusBelgiumBelizeBoliviaBosnia and HerzegovinaBrazilBulgariaBurma/MyanmarCabo VerdeCambodiaCameroonCanadaCaribbeanCentral AmericaChileChinaColombiaCongoCosta RicaCroatiaCubaCzechoslovakiaDenmarkDominicaDominican RepublicEastern AfricaEastern AsiaEastern EuropeEcuadorEgyptEl SalvadorEnglandEritreaEthiopiaEuropeFijiFranceGermanyGhanaGreeceGrenadaGuatemalaGuyanaHaitiHondurasHong KongHungaryIndiaIndonesiaIranIraqIrelandIsraelItalyJamaicaJapanJordanKazakhstanKenyaKoreaKuwaitLaosLatin AmericaLatviaLebanonLiberiaLithuaniaMalaysiaMexicoMicronesiaMiddle AfricaMoldovaMoroccoNepalNetherlandsNicaraguaNigeriaNorth AmericaNorth MacedoniaNorthern AfricaNorthern EuropeNorwayOceaniaPakistanPanamaPeruPhilippinesPolandPortugalRomaniaRussiaSaudi ArabiaScotlandSenegalSerbiaSierra LeoneSingaporeSomaliaSouth AfricaSouth AmericaSouth Central AsiaSouth Eastern AsiaSouthern EuropeSpainSri LankaSt. Vincent and the GrenadinesSudanSwedenSwitzerlandSyriaTaiwanThailandTrinidad and TobagoTurkeyUgandaUkraineUruguayUzbekistanVenezuelaVietnamWest IndiesWestern AfricaWestern AsiaWestern EuropeYemenZaireZimbabweAzores
African
Race
Ancestry
AfghanAfricanAlaska NativeAlaskan AthabascanAlbanianAleutAlsatianAmericanApacheArabArapahoArgentineanArmenianAssyrian/Chaldean/SyriacAustralianAustrianBahamianBangladeshiBarbadianBasqueBelgianBelizeanBermudanBhutaneseBlackfeetBolivianBrazilianBritishBritish West IndianBulgarianBurmeseCajunCambodianCanadianCape VerdeanCarpatho RusynCelticCentral AmericanCentral American IndianCherokeeCheyenneChickasawChileanChineseChippewaChoctawColombianColvilleComancheCosta RicanCreeCreekCroatianCrowCubanCypriotCzechCzechoslovakianDanishDelawareDominicanDutchDutch West IndianEastern EuropeanEcuadorianEgyptianEnglishEstonianEthiopianEuropeanFijianFilipinoFinnishFrenchFrench American IndianFrench CanadianGermanGerman RussianGhanaianGreekGuamanian/ChamorroGuatemalanGuyaneseHaitianHmongHonduranHopiHoumaHungarianIcelanderIndian (Asian)IndonesianInupiatIranianIraqiIrishIroquoisIsraeliItalianJamaicanJapaneseJordanianKenyanKiowaKoreanLaotianLatvianLebaneseLiberianLithuanianLumbeeLuxembourgerMacedonianMalaysianMalteseMarshalleseMenomineeMexicanMexican American IndianMongolianMoroccanNative HawaiianNavajoNepaleseNew ZealanderNicaraguanNigerianNorthern EuropeanNorwegianOkinawanOsageOttawaPaiutePakistaniPalestinianPanamanianParaguayanPennsylvania GermanPeruvianPimaPolishPortuguesePotawatomiPuebloPuerto RicanPuget Sound SalishRomanianRussianSalvadoranSamoanScandinavianScotch-IrishScottishSeminoleSenegaleseSerbianShoshoneSierra LeoneanSiouxSlavicSlovakSloveneSomaliSouth AfricanSouth AmericanSouth American IndianSoviet UnionSpaniardSpanishSpanish AmericanSpanish American IndianSri LankanSubsaharan AfricanSudaneseSwedishSwissSyrianTaiwaneseThaiTlingit-HaidaTohono O'OdhamTonganTrinidadian and TobagonianTsimshianTurkishU.S. Virgin IslanderUgandanUkrainianUruguayanUteVenezuelanVietnameseWelshWest IndianYakamaYaquiYugoslavianYumanYup'ikZimbabwean
Immigration
NonimmigrantsImmigrantsAfghanistanAfricaAlbaniaArgentinaArmeniaAsiaAustraliaAustriaBahamasBangladeshBarbadosBelarusBelgiumBelizeBoliviaBosnia and HerzegovinaBrazilBulgariaBurma/MyanmarCabo VerdeCambodiaCameroonCanadaCaribbeanCentral AmericaChileChinaColombiaCongoCosta RicaCroatiaCubaCzechoslovakiaDenmarkDominicaDominican RepublicEastern AfricaEastern AsiaEastern EuropeEcuadorEgyptEl SalvadorEnglandEritreaEthiopiaEuropeFijiFranceGermanyGhanaGreeceGrenadaGuatemalaGuyanaHaitiHondurasHong KongHungaryIndiaIndonesiaIranIraqIrelandIsraelItalyJamaicaJapanJordanKazakhstanKenyaKoreaKuwaitLaosLatin AmericaLatviaLebanonLiberiaLithuaniaMalaysiaMexicoMicronesiaMiddle AfricaMoldovaMoroccoNepalNetherlandsNicaraguaNigeriaNorth AmericaNorth MacedoniaNorthern AfricaNorthern EuropeNorwayOceaniaPakistanPanamaPeruPhilippinesPolandPortugalRomaniaRussiaSaudi ArabiaScotlandSenegalSerbiaSierra LeoneSingaporeSomaliaSouth AfricaSouth AmericaSouth Central AsiaSouth Eastern AsiaSouthern EuropeSpainSri LankaSt. Vincent and the GrenadinesSudanSwedenSwitzerlandSyriaTaiwanThailandTrinidad and TobagoUgandaUkraineUruguayUzbekistanVenezuelaVietnamWest IndiesWestern AfricaWestern AsiaWestern EuropeYemenZaireZimbabweAzores
Poverty
Income
Poverty
Unemployment
Labor Participation
Family Structure
Vehicle Availability
Education Level
Disability

Poverty Comparison

Immigrants from Turkey

Africans

Exceptional
Tragic
11.6%
POVERTY
91.7/ 100
METRIC RATING
109th/ 347
METRIC RANK
15.6%
POVERTY
0.0/ 100
METRIC RATING
307th/ 347
METRIC RANK

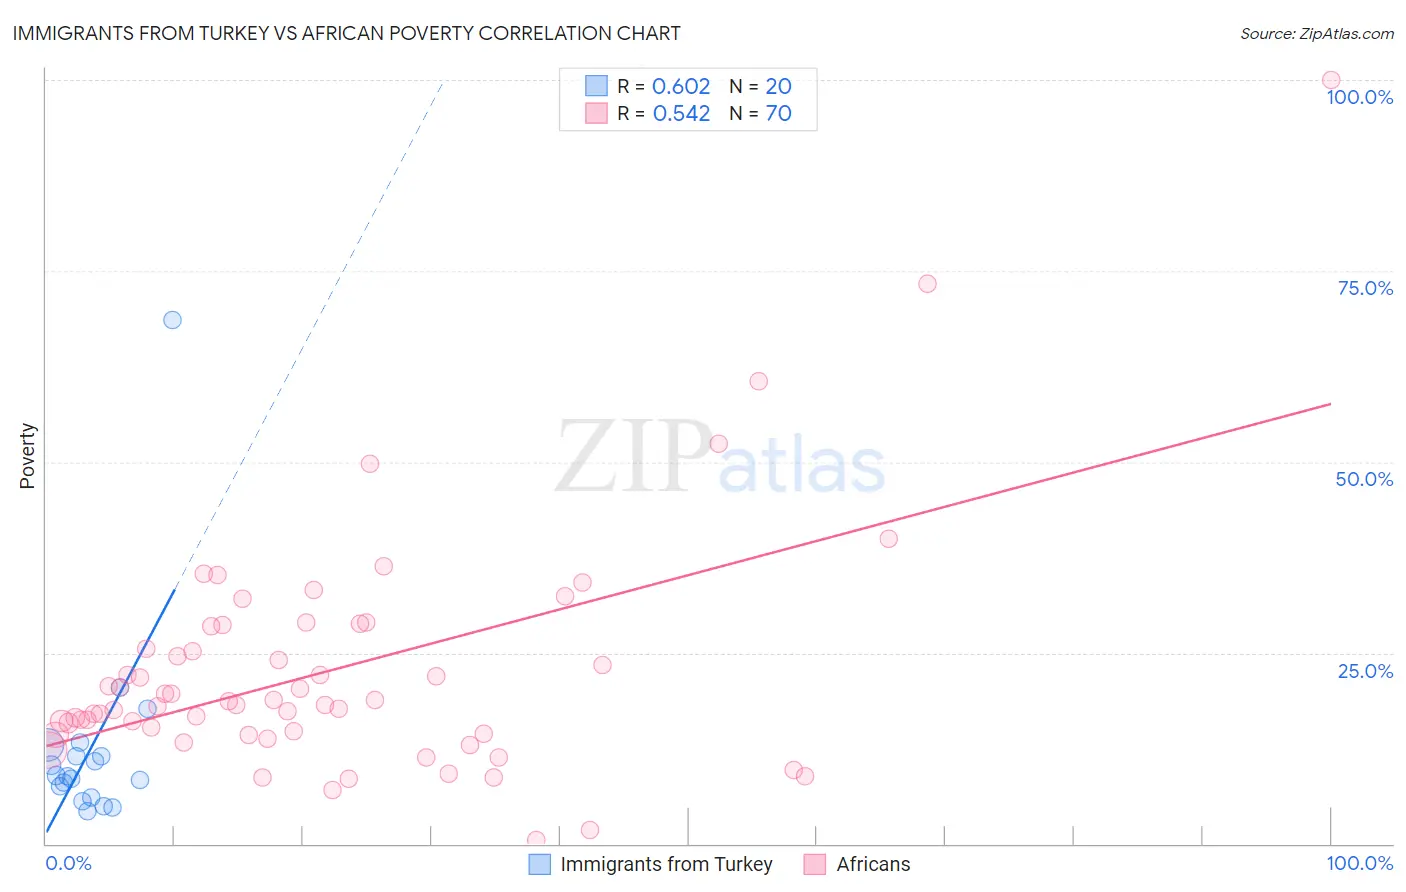
Immigrants from Turkey vs African Poverty Correlation Chart

The statistical analysis conducted on geographies consisting of 222,977,543 people shows a significant positive correlation between the proportion of Immigrants from Turkey and poverty level in the United States with a correlation coefficient (R) of 0.602 and weighted average of 11.6%. Similarly, the statistical analysis conducted on geographies consisting of 469,617,855 people shows a substantial positive correlation between the proportion of Africans and poverty level in the United States with a correlation coefficient (R) of 0.542 and weighted average of 15.6%, a difference of 34.3%.
Immigrants from Turkey vs African Poverty

Poverty Correlation Summary

MeasurementImmigrants from TurkeyAfrican
Minimum4.2%0.57%
Maximum68.6%100.0%
Range64.4%99.4%
Mean12.6%22.7%
Median8.9%18.4%
Interquartile 25% (IQ1)6.8%14.4%
Interquartile 75% (IQ3)12.3%28.5%
Interquartile Range (IQR)5.4%14.0%
Standard Deviation (Sample)13.8%15.6%
Standard Deviation (Population)13.5%15.5%

Similar Demographics by Poverty

Demographics Similar to Immigrants from Turkey by Poverty

In terms of poverty, the demographic groups most similar to Immigrants from Turkey are Canadian (11.6%, a difference of 0.010%), Welsh (11.6%, a difference of 0.040%), Palestinian (11.6%, a difference of 0.050%), Portuguese (11.6%, a difference of 0.14%), and Immigrants from Zimbabwe (11.6%, a difference of 0.14%).
DemographicsRating | RankPoverty
Laotians
92.4
/100
|
#102
Exceptional
11.6%
Okinawans
92.4
/100
|
#103
Exceptional
11.6%
Native Hawaiians
92.1
/100
|
#104
Exceptional
11.6%
Portuguese
92.1
/100
|
#105
Exceptional
11.6%
Immigrants | Zimbabwe
92.1
/100
|
#106
Exceptional
11.6%
Palestinians
91.8
/100
|
#107
Exceptional
11.6%
Canadians
91.7
/100
|
#108
Exceptional
11.6%
Immigrants | Turkey
91.7
/100
|
#109
Exceptional
11.6%
Welsh
91.6
/100
|
#110
Exceptional
11.6%
French Canadians
91.0
/100
|
#111
Exceptional
11.6%
Immigrants | Southern Europe
90.8
/100
|
#112
Exceptional
11.6%
Immigrants | Belarus
90.8
/100
|
#113
Exceptional
11.6%
Immigrants | China
90.7
/100
|
#114
Exceptional
11.6%
Albanians
90.3
/100
|
#115
Exceptional
11.7%
Immigrants | Russia
89.7
/100
|
#116
Excellent
11.7%

Demographics Similar to Africans by Poverty

In terms of poverty, the demographic groups most similar to Africans are Creek (15.6%, a difference of 0.070%), Choctaw (15.6%, a difference of 0.11%), Seminole (15.6%, a difference of 0.15%), Dutch West Indian (15.6%, a difference of 0.24%), and Immigrants from Guatemala (15.5%, a difference of 0.51%).
DemographicsRating | RankPoverty
Immigrants | Central America
0.0
/100
|
#300
Tragic
15.4%
Bahamians
0.0
/100
|
#301
Tragic
15.4%
Somalis
0.0
/100
|
#302
Tragic
15.4%
Immigrants | Caribbean
0.0
/100
|
#303
Tragic
15.5%
Immigrants | Mexico
0.0
/100
|
#304
Tragic
15.5%
Immigrants | Guatemala
0.0
/100
|
#305
Tragic
15.5%
Creek
0.0
/100
|
#306
Tragic
15.6%
Africans
0.0
/100
|
#307
Tragic
15.6%
Choctaw
0.0
/100
|
#308
Tragic
15.6%
Seminole
0.0
/100
|
#309
Tragic
15.6%
Dutch West Indians
0.0
/100
|
#310
Tragic
15.6%
Chippewa
0.0
/100
|
#311
Tragic
15.7%
Cajuns
0.0
/100
|
#312
Tragic
15.7%
Immigrants | Grenada
0.0
/100
|
#313
Tragic
15.8%
Immigrants | Somalia
0.0
/100
|
#314
Tragic
15.8%