Immigrants from Latin America vs African Poverty
COMPARE
Immigrants from Latin America
African
Poverty
Poverty Comparison
Immigrants from Latin America
Africans
15.0%
POVERTY
0.0/ 100
METRIC RATING
286th/ 347
METRIC RANK
15.6%
POVERTY
0.0/ 100
METRIC RATING
307th/ 347
METRIC RANK
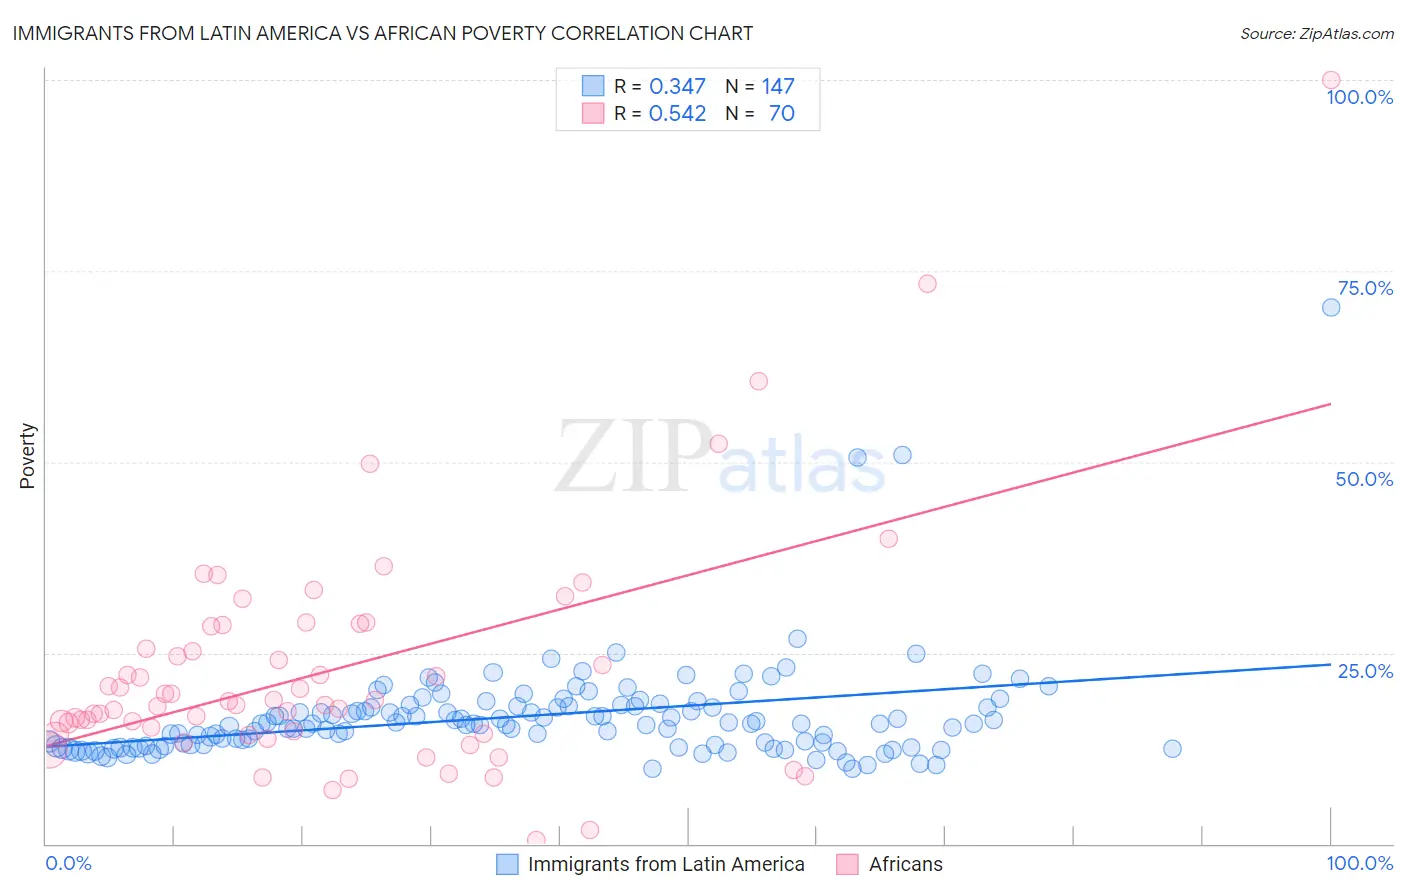
Immigrants from Latin America vs African Poverty Correlation Chart
The statistical analysis conducted on geographies consisting of 557,920,338 people shows a mild positive correlation between the proportion of Immigrants from Latin America and poverty level in the United States with a correlation coefficient (R) of 0.347 and weighted average of 15.0%. Similarly, the statistical analysis conducted on geographies consisting of 469,617,855 people shows a substantial positive correlation between the proportion of Africans and poverty level in the United States with a correlation coefficient (R) of 0.542 and weighted average of 15.6%, a difference of 3.7%.
Poverty Correlation Summary
| Measurement | Immigrants from Latin America | African |
| Minimum | 9.8% | 0.57% |
| Maximum | 70.2% | 100.0% |
| Range | 60.4% | 99.4% |
| Mean | 16.7% | 22.7% |
| Median | 15.7% | 18.4% |
| Interquartile 25% (IQ1) | 12.9% | 14.4% |
| Interquartile 75% (IQ3) | 17.9% | 28.5% |
| Interquartile Range (IQR) | 5.0% | 14.0% |
| Standard Deviation (Sample) | 6.9% | 15.6% |
| Standard Deviation (Population) | 6.9% | 15.5% |
Similar Demographics by Poverty
Demographics Similar to Immigrants from Latin America by Poverty
In terms of poverty, the demographic groups most similar to Immigrants from Latin America are Inupiat (15.1%, a difference of 0.21%), Yaqui (15.1%, a difference of 0.22%), Vietnamese (15.0%, a difference of 0.26%), West Indian (15.0%, a difference of 0.32%), and Immigrants from Belize (15.1%, a difference of 0.34%).
| Demographics | Rating | Rank | Poverty |
| Immigrants | St. Vincent and the Grenadines | 0.0 /100 | #279 | Tragic 14.9% |
| Haitians | 0.0 /100 | #280 | Tragic 14.9% |
| Immigrants | Barbados | 0.0 /100 | #281 | Tragic 14.9% |
| Comanche | 0.0 /100 | #282 | Tragic 15.0% |
| Immigrants | Haiti | 0.0 /100 | #283 | Tragic 15.0% |
| West Indians | 0.0 /100 | #284 | Tragic 15.0% |
| Vietnamese | 0.0 /100 | #285 | Tragic 15.0% |
| Immigrants | Latin America | 0.0 /100 | #286 | Tragic 15.0% |
| Inupiat | 0.0 /100 | #287 | Tragic 15.1% |
| Yaqui | 0.0 /100 | #288 | Tragic 15.1% |
| Immigrants | Belize | 0.0 /100 | #289 | Tragic 15.1% |
| Mexicans | 0.0 /100 | #290 | Tragic 15.1% |
| Immigrants | Cabo Verde | 0.0 /100 | #291 | Tragic 15.1% |
| Indonesians | 0.0 /100 | #292 | Tragic 15.1% |
| Immigrants | Zaire | 0.0 /100 | #293 | Tragic 15.1% |
Demographics Similar to Africans by Poverty
In terms of poverty, the demographic groups most similar to Africans are Creek (15.6%, a difference of 0.070%), Choctaw (15.6%, a difference of 0.11%), Seminole (15.6%, a difference of 0.15%), Dutch West Indian (15.6%, a difference of 0.24%), and Immigrants from Guatemala (15.5%, a difference of 0.51%).
| Demographics | Rating | Rank | Poverty |
| Immigrants | Central America | 0.0 /100 | #300 | Tragic 15.4% |
| Bahamians | 0.0 /100 | #301 | Tragic 15.4% |
| Somalis | 0.0 /100 | #302 | Tragic 15.4% |
| Immigrants | Caribbean | 0.0 /100 | #303 | Tragic 15.5% |
| Immigrants | Mexico | 0.0 /100 | #304 | Tragic 15.5% |
| Immigrants | Guatemala | 0.0 /100 | #305 | Tragic 15.5% |
| Creek | 0.0 /100 | #306 | Tragic 15.6% |
| Africans | 0.0 /100 | #307 | Tragic 15.6% |
| Choctaw | 0.0 /100 | #308 | Tragic 15.6% |
| Seminole | 0.0 /100 | #309 | Tragic 15.6% |
| Dutch West Indians | 0.0 /100 | #310 | Tragic 15.6% |
| Chippewa | 0.0 /100 | #311 | Tragic 15.7% |
| Cajuns | 0.0 /100 | #312 | Tragic 15.7% |
| Immigrants | Grenada | 0.0 /100 | #313 | Tragic 15.8% |
| Immigrants | Somalia | 0.0 /100 | #314 | Tragic 15.8% |