Immigrants from Northern Europe vs Immigrants from Ukraine Poverty
COMPARE
Immigrants from Northern Europe
Immigrants from Ukraine
Poverty
Poverty Comparison
Immigrants from Northern Europe
Immigrants from Ukraine
10.7%
POVERTY
99.6/ 100
METRIC RATING
27th/ 347
METRIC RANK
11.8%
POVERTY
86.6/ 100
METRIC RATING
130th/ 347
METRIC RANK
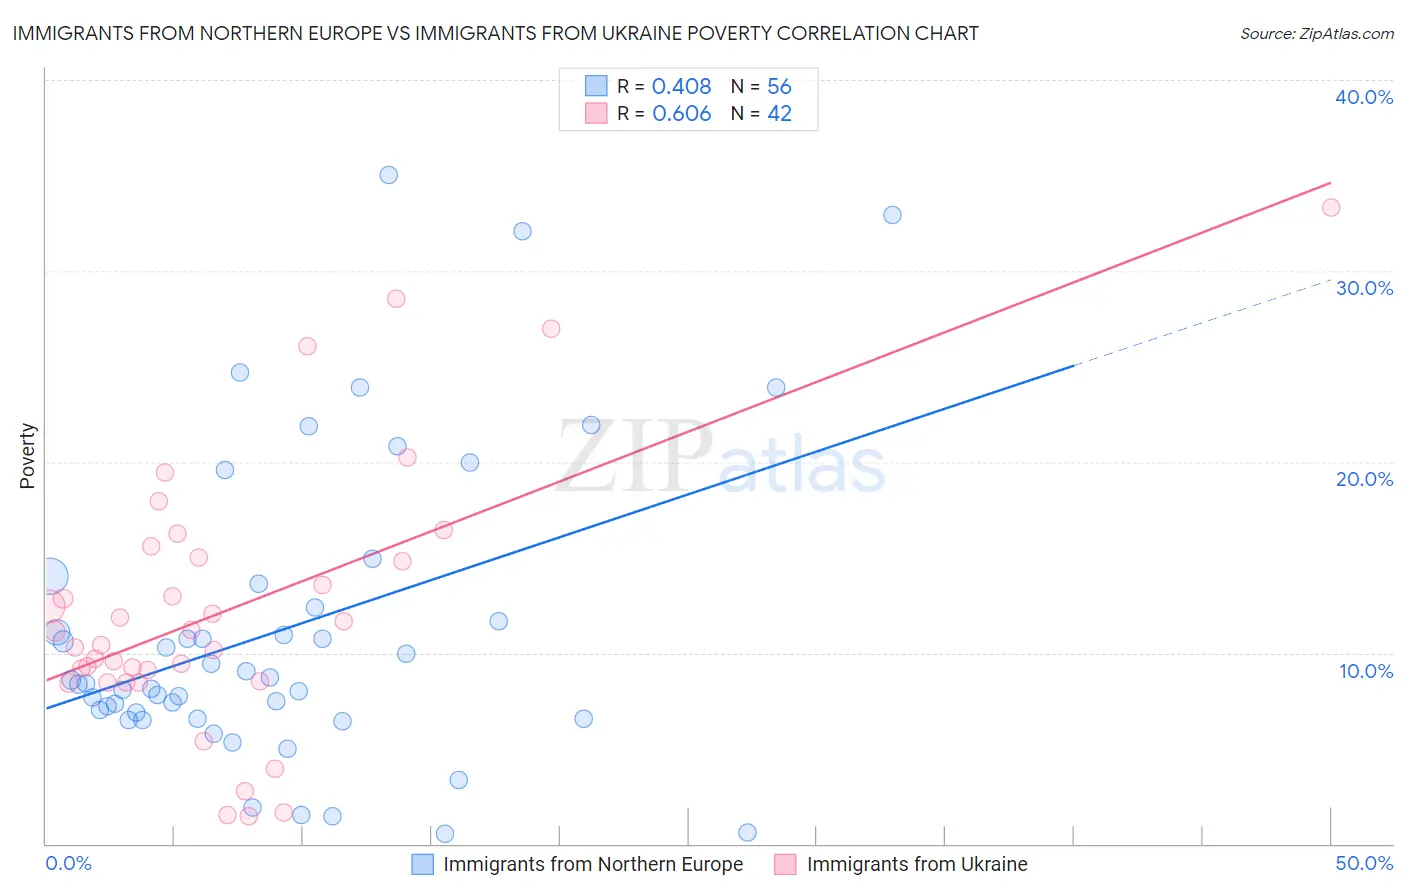
Immigrants from Northern Europe vs Immigrants from Ukraine Poverty Correlation Chart
The statistical analysis conducted on geographies consisting of 476,900,751 people shows a moderate positive correlation between the proportion of Immigrants from Northern Europe and poverty level in the United States with a correlation coefficient (R) of 0.408 and weighted average of 10.7%. Similarly, the statistical analysis conducted on geographies consisting of 289,636,773 people shows a significant positive correlation between the proportion of Immigrants from Ukraine and poverty level in the United States with a correlation coefficient (R) of 0.606 and weighted average of 11.8%, a difference of 9.9%.
Poverty Correlation Summary
| Measurement | Immigrants from Northern Europe | Immigrants from Ukraine |
| Minimum | 0.52% | 1.5% |
| Maximum | 35.0% | 33.3% |
| Range | 34.5% | 31.9% |
| Mean | 11.2% | 12.3% |
| Median | 8.5% | 10.8% |
| Interquartile 25% (IQ1) | 6.7% | 8.5% |
| Interquartile 75% (IQ3) | 13.0% | 15.0% |
| Interquartile Range (IQR) | 6.3% | 6.5% |
| Standard Deviation (Sample) | 7.9% | 7.0% |
| Standard Deviation (Population) | 7.9% | 6.9% |
Similar Demographics by Poverty
Demographics Similar to Immigrants from Northern Europe by Poverty
In terms of poverty, the demographic groups most similar to Immigrants from Northern Europe are Immigrants from Korea (10.7%, a difference of 0.070%), Greek (10.7%, a difference of 0.16%), Danish (10.7%, a difference of 0.17%), Polish (10.7%, a difference of 0.25%), and Iranian (10.7%, a difference of 0.34%).
| Demographics | Rating | Rank | Poverty |
| Immigrants | North Macedonia | 99.7 /100 | #20 | Exceptional 10.6% |
| Luxembourgers | 99.7 /100 | #21 | Exceptional 10.6% |
| Eastern Europeans | 99.7 /100 | #22 | Exceptional 10.6% |
| Swedes | 99.7 /100 | #23 | Exceptional 10.6% |
| Italians | 99.7 /100 | #24 | Exceptional 10.6% |
| Croatians | 99.6 /100 | #25 | Exceptional 10.6% |
| Burmese | 99.6 /100 | #26 | Exceptional 10.7% |
| Immigrants | Northern Europe | 99.6 /100 | #27 | Exceptional 10.7% |
| Immigrants | Korea | 99.5 /100 | #28 | Exceptional 10.7% |
| Greeks | 99.5 /100 | #29 | Exceptional 10.7% |
| Danes | 99.5 /100 | #30 | Exceptional 10.7% |
| Poles | 99.5 /100 | #31 | Exceptional 10.7% |
| Iranians | 99.5 /100 | #32 | Exceptional 10.7% |
| Macedonians | 99.4 /100 | #33 | Exceptional 10.8% |
| Immigrants | Poland | 99.4 /100 | #34 | Exceptional 10.8% |
Demographics Similar to Immigrants from Ukraine by Poverty
In terms of poverty, the demographic groups most similar to Immigrants from Ukraine are South African (11.7%, a difference of 0.090%), French (11.8%, a difference of 0.10%), Immigrants from Israel (11.7%, a difference of 0.19%), Peruvian (11.8%, a difference of 0.21%), and Immigrants from Western Europe (11.8%, a difference of 0.29%).
| Demographics | Rating | Rank | Poverty |
| Immigrants | Hungary | 88.6 /100 | #123 | Excellent 11.7% |
| Soviet Union | 88.4 /100 | #124 | Excellent 11.7% |
| Immigrants | Brazil | 88.2 /100 | #125 | Excellent 11.7% |
| Immigrants | Norway | 88.0 /100 | #126 | Excellent 11.7% |
| Immigrants | Argentina | 88.0 /100 | #127 | Excellent 11.7% |
| Immigrants | Israel | 87.4 /100 | #128 | Excellent 11.7% |
| South Africans | 87.0 /100 | #129 | Excellent 11.7% |
| Immigrants | Ukraine | 86.6 /100 | #130 | Excellent 11.8% |
| French | 86.1 /100 | #131 | Excellent 11.8% |
| Peruvians | 85.6 /100 | #132 | Excellent 11.8% |
| Immigrants | Western Europe | 85.2 /100 | #133 | Excellent 11.8% |
| Yugoslavians | 85.2 /100 | #134 | Excellent 11.8% |
| Immigrants | Vietnam | 85.2 /100 | #135 | Excellent 11.8% |
| Chileans | 84.2 /100 | #136 | Excellent 11.8% |
| Immigrants | Switzerland | 83.0 /100 | #137 | Excellent 11.8% |