Immigrants from Northern Europe vs Immigrants from Australia Poverty
COMPARE
Immigrants from Northern Europe
Immigrants from Australia
Poverty
Poverty Comparison
Immigrants from Northern Europe
Immigrants from Australia
10.7%
POVERTY
99.6/ 100
METRIC RATING
27th/ 347
METRIC RANK
11.2%
POVERTY
97.4/ 100
METRIC RATING
67th/ 347
METRIC RANK
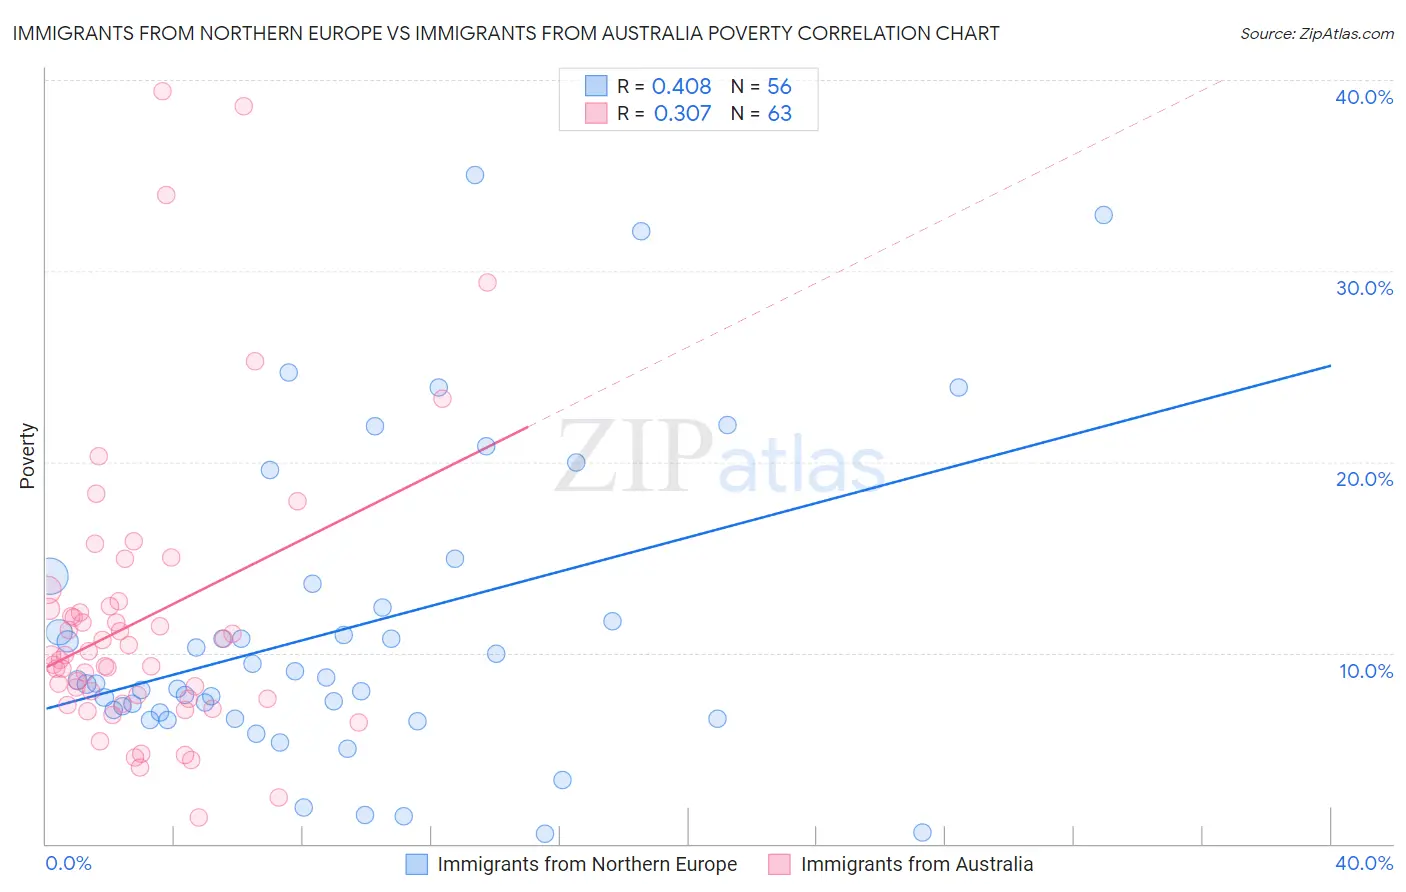
Immigrants from Northern Europe vs Immigrants from Australia Poverty Correlation Chart
The statistical analysis conducted on geographies consisting of 476,900,751 people shows a moderate positive correlation between the proportion of Immigrants from Northern Europe and poverty level in the United States with a correlation coefficient (R) of 0.408 and weighted average of 10.7%. Similarly, the statistical analysis conducted on geographies consisting of 227,147,878 people shows a mild positive correlation between the proportion of Immigrants from Australia and poverty level in the United States with a correlation coefficient (R) of 0.307 and weighted average of 11.2%, a difference of 4.9%.
Poverty Correlation Summary
| Measurement | Immigrants from Northern Europe | Immigrants from Australia |
| Minimum | 0.52% | 1.4% |
| Maximum | 35.0% | 39.4% |
| Range | 34.5% | 38.1% |
| Mean | 11.2% | 11.8% |
| Median | 8.5% | 9.9% |
| Interquartile 25% (IQ1) | 6.7% | 7.6% |
| Interquartile 75% (IQ3) | 13.0% | 12.5% |
| Interquartile Range (IQR) | 6.3% | 4.9% |
| Standard Deviation (Sample) | 7.9% | 7.7% |
| Standard Deviation (Population) | 7.9% | 7.6% |
Similar Demographics by Poverty
Demographics Similar to Immigrants from Northern Europe by Poverty
In terms of poverty, the demographic groups most similar to Immigrants from Northern Europe are Immigrants from Korea (10.7%, a difference of 0.070%), Greek (10.7%, a difference of 0.16%), Danish (10.7%, a difference of 0.17%), Polish (10.7%, a difference of 0.25%), and Iranian (10.7%, a difference of 0.34%).
| Demographics | Rating | Rank | Poverty |
| Immigrants | North Macedonia | 99.7 /100 | #20 | Exceptional 10.6% |
| Luxembourgers | 99.7 /100 | #21 | Exceptional 10.6% |
| Eastern Europeans | 99.7 /100 | #22 | Exceptional 10.6% |
| Swedes | 99.7 /100 | #23 | Exceptional 10.6% |
| Italians | 99.7 /100 | #24 | Exceptional 10.6% |
| Croatians | 99.6 /100 | #25 | Exceptional 10.6% |
| Burmese | 99.6 /100 | #26 | Exceptional 10.7% |
| Immigrants | Northern Europe | 99.6 /100 | #27 | Exceptional 10.7% |
| Immigrants | Korea | 99.5 /100 | #28 | Exceptional 10.7% |
| Greeks | 99.5 /100 | #29 | Exceptional 10.7% |
| Danes | 99.5 /100 | #30 | Exceptional 10.7% |
| Poles | 99.5 /100 | #31 | Exceptional 10.7% |
| Iranians | 99.5 /100 | #32 | Exceptional 10.7% |
| Macedonians | 99.4 /100 | #33 | Exceptional 10.8% |
| Immigrants | Poland | 99.4 /100 | #34 | Exceptional 10.8% |
Demographics Similar to Immigrants from Australia by Poverty
In terms of poverty, the demographic groups most similar to Immigrants from Australia are Slovak (11.2%, a difference of 0.020%), Immigrants from Netherlands (11.2%, a difference of 0.040%), Serbian (11.2%, a difference of 0.080%), Immigrants from Asia (11.2%, a difference of 0.11%), and Immigrants from Canada (11.3%, a difference of 0.17%).
| Demographics | Rating | Rank | Poverty |
| Immigrants | Sri Lanka | 97.9 /100 | #60 | Exceptional 11.2% |
| Immigrants | Italy | 97.9 /100 | #61 | Exceptional 11.2% |
| Austrians | 97.8 /100 | #62 | Exceptional 11.2% |
| Ukrainians | 97.8 /100 | #63 | Exceptional 11.2% |
| Swiss | 97.7 /100 | #64 | Exceptional 11.2% |
| Immigrants | Asia | 97.5 /100 | #65 | Exceptional 11.2% |
| Immigrants | Netherlands | 97.5 /100 | #66 | Exceptional 11.2% |
| Immigrants | Australia | 97.4 /100 | #67 | Exceptional 11.2% |
| Slovaks | 97.4 /100 | #68 | Exceptional 11.2% |
| Serbians | 97.4 /100 | #69 | Exceptional 11.2% |
| Immigrants | Canada | 97.3 /100 | #70 | Exceptional 11.3% |
| Zimbabweans | 97.3 /100 | #71 | Exceptional 11.3% |
| Europeans | 97.2 /100 | #72 | Exceptional 11.3% |
| Immigrants | Belgium | 97.2 /100 | #73 | Exceptional 11.3% |
| Carpatho Rusyns | 97.2 /100 | #74 | Exceptional 11.3% |