Immigrants from Northern Europe vs American Poverty
COMPARE
Immigrants from Northern Europe
American
Poverty
Poverty Comparison
Immigrants from Northern Europe
Americans
10.7%
POVERTY
99.6/ 100
METRIC RATING
27th/ 347
METRIC RANK
13.4%
POVERTY
2.9/ 100
METRIC RATING
220th/ 347
METRIC RANK
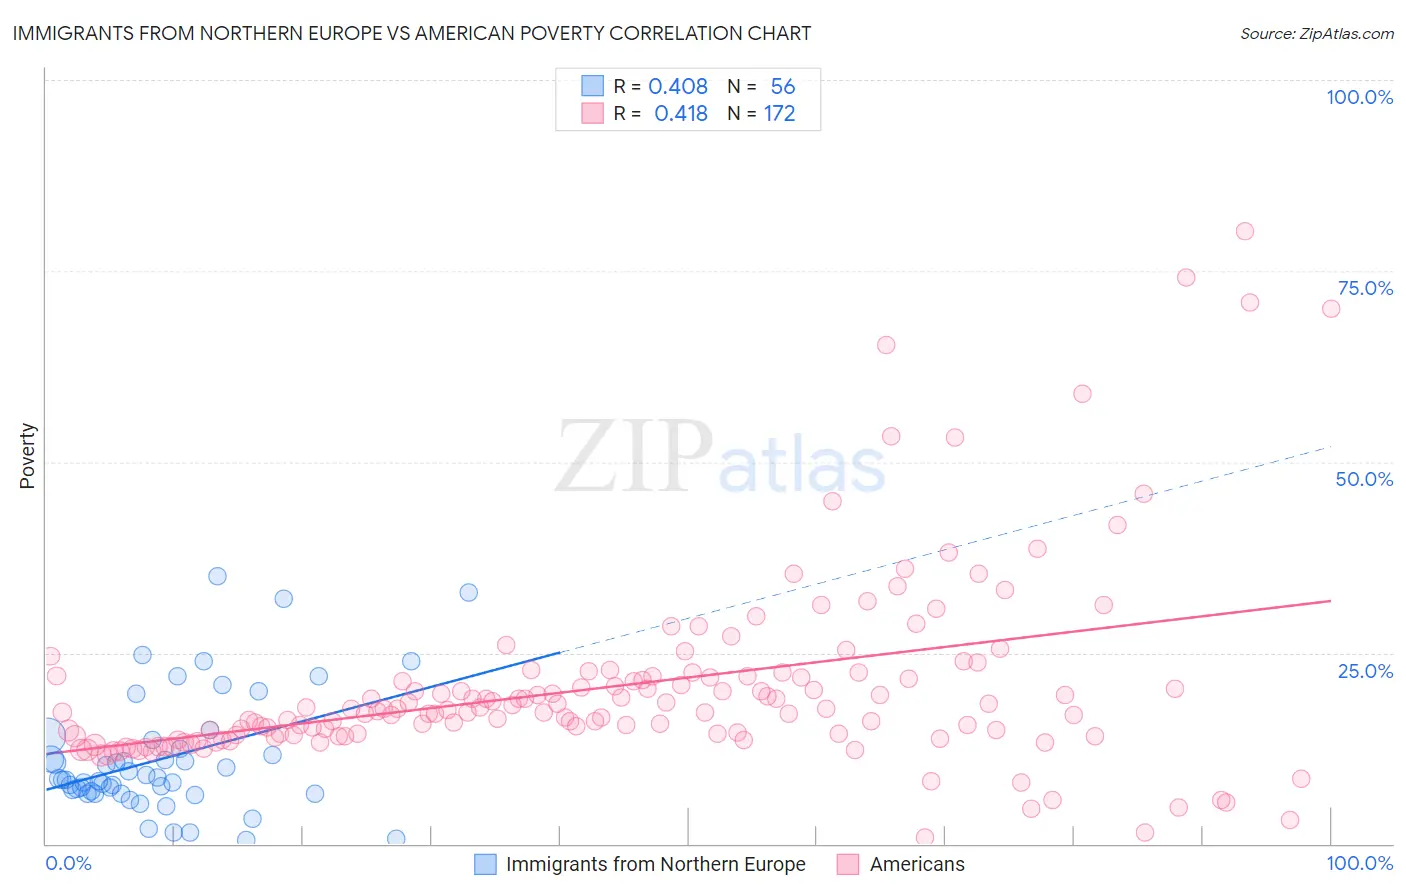
Immigrants from Northern Europe vs American Poverty Correlation Chart
The statistical analysis conducted on geographies consisting of 476,900,751 people shows a moderate positive correlation between the proportion of Immigrants from Northern Europe and poverty level in the United States with a correlation coefficient (R) of 0.408 and weighted average of 10.7%. Similarly, the statistical analysis conducted on geographies consisting of 580,977,330 people shows a moderate positive correlation between the proportion of Americans and poverty level in the United States with a correlation coefficient (R) of 0.418 and weighted average of 13.4%, a difference of 24.9%.
Poverty Correlation Summary
| Measurement | Immigrants from Northern Europe | American |
| Minimum | 0.52% | 0.85% |
| Maximum | 35.0% | 80.3% |
| Range | 34.5% | 79.4% |
| Mean | 11.2% | 20.5% |
| Median | 8.5% | 17.2% |
| Interquartile 25% (IQ1) | 6.7% | 14.1% |
| Interquartile 75% (IQ3) | 13.0% | 21.9% |
| Interquartile Range (IQR) | 6.3% | 7.8% |
| Standard Deviation (Sample) | 7.9% | 12.6% |
| Standard Deviation (Population) | 7.9% | 12.5% |
Similar Demographics by Poverty
Demographics Similar to Immigrants from Northern Europe by Poverty
In terms of poverty, the demographic groups most similar to Immigrants from Northern Europe are Immigrants from Korea (10.7%, a difference of 0.070%), Greek (10.7%, a difference of 0.16%), Danish (10.7%, a difference of 0.17%), Polish (10.7%, a difference of 0.25%), and Iranian (10.7%, a difference of 0.34%).
| Demographics | Rating | Rank | Poverty |
| Immigrants | North Macedonia | 99.7 /100 | #20 | Exceptional 10.6% |
| Luxembourgers | 99.7 /100 | #21 | Exceptional 10.6% |
| Eastern Europeans | 99.7 /100 | #22 | Exceptional 10.6% |
| Swedes | 99.7 /100 | #23 | Exceptional 10.6% |
| Italians | 99.7 /100 | #24 | Exceptional 10.6% |
| Croatians | 99.6 /100 | #25 | Exceptional 10.6% |
| Burmese | 99.6 /100 | #26 | Exceptional 10.7% |
| Immigrants | Northern Europe | 99.6 /100 | #27 | Exceptional 10.7% |
| Immigrants | Korea | 99.5 /100 | #28 | Exceptional 10.7% |
| Greeks | 99.5 /100 | #29 | Exceptional 10.7% |
| Danes | 99.5 /100 | #30 | Exceptional 10.7% |
| Poles | 99.5 /100 | #31 | Exceptional 10.7% |
| Iranians | 99.5 /100 | #32 | Exceptional 10.7% |
| Macedonians | 99.4 /100 | #33 | Exceptional 10.8% |
| Immigrants | Poland | 99.4 /100 | #34 | Exceptional 10.8% |
Demographics Similar to Americans by Poverty
In terms of poverty, the demographic groups most similar to Americans are Immigrants from Cambodia (13.4%, a difference of 0.090%), Alsatian (13.4%, a difference of 0.20%), Immigrants from Thailand (13.3%, a difference of 0.21%), Immigrants from Micronesia (13.4%, a difference of 0.24%), and Immigrants from Uzbekistan (13.3%, a difference of 0.28%).
| Demographics | Rating | Rank | Poverty |
| Immigrants | Panama | 4.1 /100 | #213 | Tragic 13.3% |
| Bermudans | 3.7 /100 | #214 | Tragic 13.3% |
| Japanese | 3.3 /100 | #215 | Tragic 13.3% |
| Immigrants | Nonimmigrants | 3.3 /100 | #216 | Tragic 13.3% |
| Immigrants | Uzbekistan | 3.2 /100 | #217 | Tragic 13.3% |
| Immigrants | Thailand | 3.1 /100 | #218 | Tragic 13.3% |
| Immigrants | Cambodia | 3.0 /100 | #219 | Tragic 13.4% |
| Americans | 2.9 /100 | #220 | Tragic 13.4% |
| Alsatians | 2.6 /100 | #221 | Tragic 13.4% |
| Immigrants | Micronesia | 2.6 /100 | #222 | Tragic 13.4% |
| Immigrants | Africa | 2.5 /100 | #223 | Tragic 13.4% |
| Immigrants | Eritrea | 2.4 /100 | #224 | Tragic 13.4% |
| German Russians | 2.2 /100 | #225 | Tragic 13.4% |
| Marshallese | 2.2 /100 | #226 | Tragic 13.4% |
| Alaska Natives | 2.1 /100 | #227 | Tragic 13.5% |