Immigrants from Northern Europe vs Northern European Poverty
COMPARE
Immigrants from Northern Europe
Northern European
Poverty
Poverty Comparison
Immigrants from Northern Europe
Northern Europeans
10.7%
POVERTY
99.6/ 100
METRIC RATING
27th/ 347
METRIC RANK
11.4%
POVERTY
96.0/ 100
METRIC RATING
87th/ 347
METRIC RANK
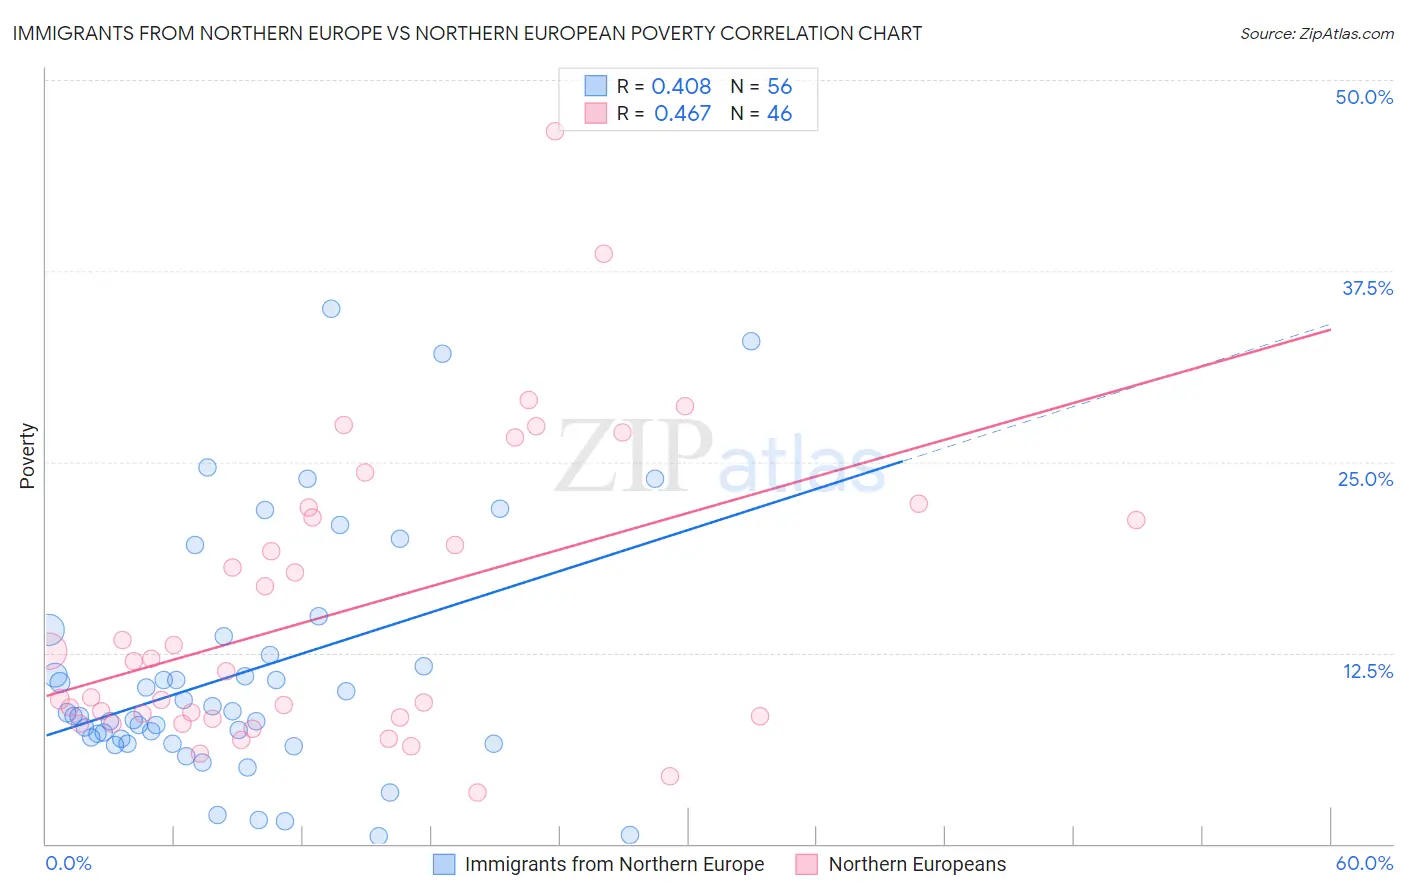
Immigrants from Northern Europe vs Northern European Poverty Correlation Chart
The statistical analysis conducted on geographies consisting of 476,900,751 people shows a moderate positive correlation between the proportion of Immigrants from Northern Europe and poverty level in the United States with a correlation coefficient (R) of 0.408 and weighted average of 10.7%. Similarly, the statistical analysis conducted on geographies consisting of 405,898,980 people shows a moderate positive correlation between the proportion of Northern Europeans and poverty level in the United States with a correlation coefficient (R) of 0.467 and weighted average of 11.4%, a difference of 6.2%.
Poverty Correlation Summary
| Measurement | Immigrants from Northern Europe | Northern European |
| Minimum | 0.52% | 3.3% |
| Maximum | 35.0% | 46.6% |
| Range | 34.5% | 43.3% |
| Mean | 11.2% | 15.2% |
| Median | 8.5% | 11.6% |
| Interquartile 25% (IQ1) | 6.7% | 8.3% |
| Interquartile 75% (IQ3) | 13.0% | 21.4% |
| Interquartile Range (IQR) | 6.3% | 13.1% |
| Standard Deviation (Sample) | 7.9% | 9.5% |
| Standard Deviation (Population) | 7.9% | 9.4% |
Similar Demographics by Poverty
Demographics Similar to Immigrants from Northern Europe by Poverty
In terms of poverty, the demographic groups most similar to Immigrants from Northern Europe are Immigrants from Korea (10.7%, a difference of 0.070%), Greek (10.7%, a difference of 0.16%), Danish (10.7%, a difference of 0.17%), Polish (10.7%, a difference of 0.25%), and Iranian (10.7%, a difference of 0.34%).
| Demographics | Rating | Rank | Poverty |
| Immigrants | North Macedonia | 99.7 /100 | #20 | Exceptional 10.6% |
| Luxembourgers | 99.7 /100 | #21 | Exceptional 10.6% |
| Eastern Europeans | 99.7 /100 | #22 | Exceptional 10.6% |
| Swedes | 99.7 /100 | #23 | Exceptional 10.6% |
| Italians | 99.7 /100 | #24 | Exceptional 10.6% |
| Croatians | 99.6 /100 | #25 | Exceptional 10.6% |
| Burmese | 99.6 /100 | #26 | Exceptional 10.7% |
| Immigrants | Northern Europe | 99.6 /100 | #27 | Exceptional 10.7% |
| Immigrants | Korea | 99.5 /100 | #28 | Exceptional 10.7% |
| Greeks | 99.5 /100 | #29 | Exceptional 10.7% |
| Danes | 99.5 /100 | #30 | Exceptional 10.7% |
| Poles | 99.5 /100 | #31 | Exceptional 10.7% |
| Iranians | 99.5 /100 | #32 | Exceptional 10.7% |
| Macedonians | 99.4 /100 | #33 | Exceptional 10.8% |
| Immigrants | Poland | 99.4 /100 | #34 | Exceptional 10.8% |
Demographics Similar to Northern Europeans by Poverty
In terms of poverty, the demographic groups most similar to Northern Europeans are Jordanian (11.4%, a difference of 0.0%), Immigrants from England (11.4%, a difference of 0.12%), Belgian (11.4%, a difference of 0.14%), Czechoslovakian (11.4%, a difference of 0.18%), and English (11.3%, a difference of 0.19%).
| Demographics | Rating | Rank | Poverty |
| Indians (Asian) | 96.6 /100 | #80 | Exceptional 11.3% |
| Irish | 96.6 /100 | #81 | Exceptional 11.3% |
| Egyptians | 96.5 /100 | #82 | Exceptional 11.3% |
| Immigrants | Sweden | 96.3 /100 | #83 | Exceptional 11.3% |
| English | 96.3 /100 | #84 | Exceptional 11.3% |
| Immigrants | England | 96.2 /100 | #85 | Exceptional 11.4% |
| Jordanians | 96.0 /100 | #86 | Exceptional 11.4% |
| Northern Europeans | 96.0 /100 | #87 | Exceptional 11.4% |
| Belgians | 95.8 /100 | #88 | Exceptional 11.4% |
| Czechoslovakians | 95.7 /100 | #89 | Exceptional 11.4% |
| Immigrants | Denmark | 95.5 /100 | #90 | Exceptional 11.4% |
| Finns | 95.2 /100 | #91 | Exceptional 11.4% |
| British | 95.0 /100 | #92 | Exceptional 11.4% |
| Romanians | 94.9 /100 | #93 | Exceptional 11.4% |
| Paraguayans | 94.9 /100 | #94 | Exceptional 11.4% |