Immigrants from Saudi Arabia vs African Poverty
COMPARE
Immigrants from Saudi Arabia
African
Poverty
Poverty Comparison
Immigrants from Saudi Arabia
Africans
13.8%
POVERTY
0.8/ 100
METRIC RATING
233rd/ 347
METRIC RANK
15.6%
POVERTY
0.0/ 100
METRIC RATING
307th/ 347
METRIC RANK
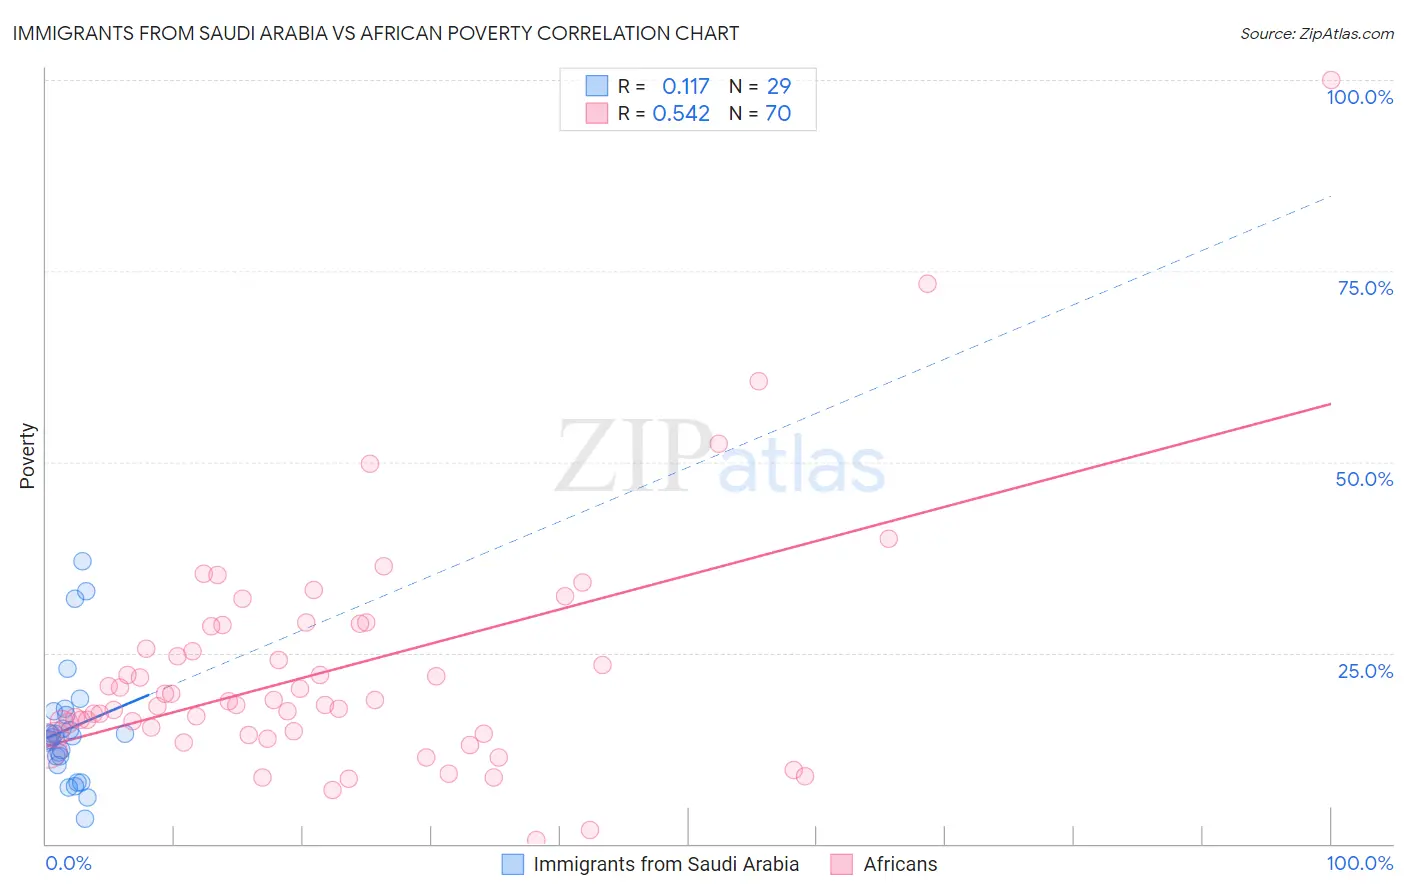
Immigrants from Saudi Arabia vs African Poverty Correlation Chart
The statistical analysis conducted on geographies consisting of 164,230,350 people shows a poor positive correlation between the proportion of Immigrants from Saudi Arabia and poverty level in the United States with a correlation coefficient (R) of 0.117 and weighted average of 13.8%. Similarly, the statistical analysis conducted on geographies consisting of 469,617,855 people shows a substantial positive correlation between the proportion of Africans and poverty level in the United States with a correlation coefficient (R) of 0.542 and weighted average of 15.6%, a difference of 13.2%.
Poverty Correlation Summary
| Measurement | Immigrants from Saudi Arabia | African |
| Minimum | 3.3% | 0.57% |
| Maximum | 37.0% | 100.0% |
| Range | 33.7% | 99.4% |
| Mean | 15.0% | 22.7% |
| Median | 14.0% | 18.4% |
| Interquartile 25% (IQ1) | 10.9% | 14.4% |
| Interquartile 75% (IQ3) | 17.1% | 28.5% |
| Interquartile Range (IQR) | 6.2% | 14.0% |
| Standard Deviation (Sample) | 7.8% | 15.6% |
| Standard Deviation (Population) | 7.6% | 15.5% |
Similar Demographics by Poverty
Demographics Similar to Immigrants from Saudi Arabia by Poverty
In terms of poverty, the demographic groups most similar to Immigrants from Saudi Arabia are Immigrants from Laos (13.8%, a difference of 0.24%), Fijian (13.7%, a difference of 0.25%), Cuban (13.9%, a difference of 0.68%), Immigrants from Armenia (13.9%, a difference of 0.71%), and French American Indian (13.9%, a difference of 0.73%).
| Demographics | Rating | Rank | Poverty |
| Marshallese | 2.2 /100 | #226 | Tragic 13.4% |
| Alaska Natives | 2.1 /100 | #227 | Tragic 13.5% |
| Immigrants | Nigeria | 1.7 /100 | #228 | Tragic 13.5% |
| Osage | 1.5 /100 | #229 | Tragic 13.6% |
| Alaskan Athabascans | 1.5 /100 | #230 | Tragic 13.6% |
| Nigerians | 1.4 /100 | #231 | Tragic 13.6% |
| Fijians | 0.8 /100 | #232 | Tragic 13.7% |
| Immigrants | Saudi Arabia | 0.8 /100 | #233 | Tragic 13.8% |
| Immigrants | Laos | 0.7 /100 | #234 | Tragic 13.8% |
| Cubans | 0.6 /100 | #235 | Tragic 13.9% |
| Immigrants | Armenia | 0.5 /100 | #236 | Tragic 13.9% |
| French American Indians | 0.5 /100 | #237 | Tragic 13.9% |
| Ghanaians | 0.5 /100 | #238 | Tragic 13.9% |
| Nicaraguans | 0.4 /100 | #239 | Tragic 13.9% |
| Immigrants | Middle Africa | 0.4 /100 | #240 | Tragic 14.0% |
Demographics Similar to Africans by Poverty
In terms of poverty, the demographic groups most similar to Africans are Creek (15.6%, a difference of 0.070%), Choctaw (15.6%, a difference of 0.11%), Seminole (15.6%, a difference of 0.15%), Dutch West Indian (15.6%, a difference of 0.24%), and Immigrants from Guatemala (15.5%, a difference of 0.51%).
| Demographics | Rating | Rank | Poverty |
| Immigrants | Central America | 0.0 /100 | #300 | Tragic 15.4% |
| Bahamians | 0.0 /100 | #301 | Tragic 15.4% |
| Somalis | 0.0 /100 | #302 | Tragic 15.4% |
| Immigrants | Caribbean | 0.0 /100 | #303 | Tragic 15.5% |
| Immigrants | Mexico | 0.0 /100 | #304 | Tragic 15.5% |
| Immigrants | Guatemala | 0.0 /100 | #305 | Tragic 15.5% |
| Creek | 0.0 /100 | #306 | Tragic 15.6% |
| Africans | 0.0 /100 | #307 | Tragic 15.6% |
| Choctaw | 0.0 /100 | #308 | Tragic 15.6% |
| Seminole | 0.0 /100 | #309 | Tragic 15.6% |
| Dutch West Indians | 0.0 /100 | #310 | Tragic 15.6% |
| Chippewa | 0.0 /100 | #311 | Tragic 15.7% |
| Cajuns | 0.0 /100 | #312 | Tragic 15.7% |
| Immigrants | Grenada | 0.0 /100 | #313 | Tragic 15.8% |
| Immigrants | Somalia | 0.0 /100 | #314 | Tragic 15.8% |