Immigrants from Northern Europe vs African In Labor Force | Age 16-19
COMPARE
Immigrants from Northern Europe
African
In Labor Force | Age 16-19
In Labor Force | Age 16-19 Comparison
Immigrants from Northern Europe
Africans
36.5%
IN LABOR FORCE | AGE 16-19
46.6/ 100
METRIC RATING
177th/ 347
METRIC RANK
38.0%
IN LABOR FORCE | AGE 16-19
95.6/ 100
METRIC RATING
126th/ 347
METRIC RANK
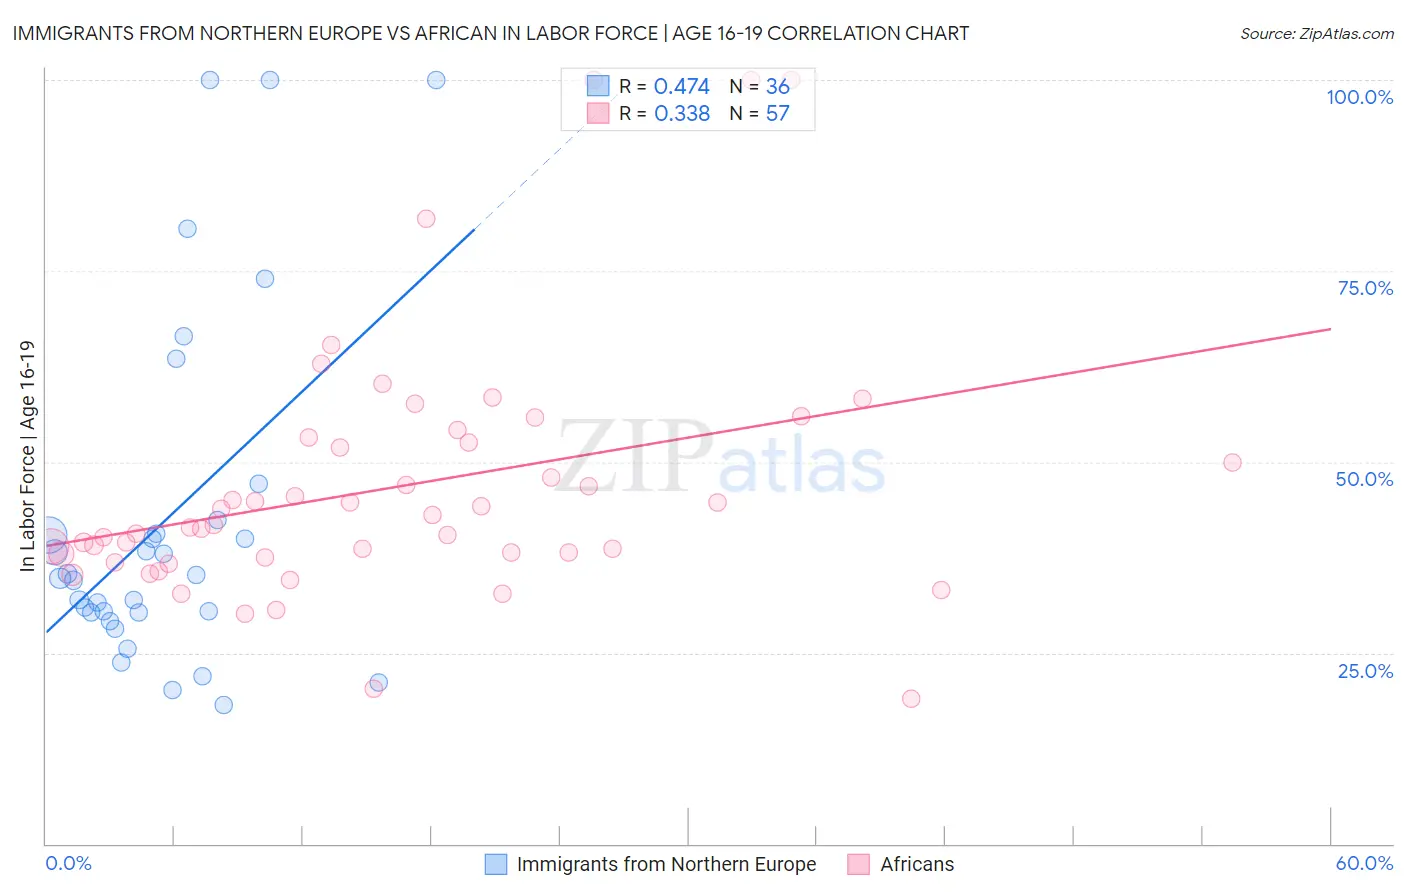
Immigrants from Northern Europe vs African In Labor Force | Age 16-19 Correlation Chart
The statistical analysis conducted on geographies consisting of 475,712,736 people shows a moderate positive correlation between the proportion of Immigrants from Northern Europe and labor force participation rate among population between the ages 16 and 19 in the United States with a correlation coefficient (R) of 0.474 and weighted average of 36.5%. Similarly, the statistical analysis conducted on geographies consisting of 469,169,744 people shows a mild positive correlation between the proportion of Africans and labor force participation rate among population between the ages 16 and 19 in the United States with a correlation coefficient (R) of 0.338 and weighted average of 38.0%, a difference of 4.1%.
In Labor Force | Age 16-19 Correlation Summary
| Measurement | Immigrants from Northern Europe | African |
| Minimum | 18.2% | 19.0% |
| Maximum | 100.0% | 100.0% |
| Range | 81.8% | 81.0% |
| Mean | 42.4% | 46.7% |
| Median | 35.0% | 41.8% |
| Interquartile 25% (IQ1) | 30.3% | 37.8% |
| Interquartile 75% (IQ3) | 41.5% | 52.9% |
| Interquartile Range (IQR) | 11.2% | 15.1% |
| Standard Deviation (Sample) | 22.5% | 16.6% |
| Standard Deviation (Population) | 22.2% | 16.5% |
Similar Demographics by In Labor Force | Age 16-19
Demographics Similar to Immigrants from Northern Europe by In Labor Force | Age 16-19
In terms of in labor force | age 16-19, the demographic groups most similar to Immigrants from Northern Europe are Black/African American (36.5%, a difference of 0.080%), Albanian (36.5%, a difference of 0.11%), Native/Alaskan (36.6%, a difference of 0.12%), Immigrants from Czechoslovakia (36.6%, a difference of 0.17%), and Immigrants from Southern Europe (36.4%, a difference of 0.17%).
| Demographics | Rating | Rank | In Labor Force | Age 16-19 |
| Immigrants | South Africa | 60.5 /100 | #170 | Good 36.8% |
| Immigrants | Cambodia | 58.4 /100 | #171 | Average 36.7% |
| South Africans | 58.3 /100 | #172 | Average 36.7% |
| Russians | 57.5 /100 | #173 | Average 36.7% |
| Immigrants | Czechoslovakia | 50.0 /100 | #174 | Average 36.6% |
| Natives/Alaskans | 49.0 /100 | #175 | Average 36.6% |
| Albanians | 48.8 /100 | #176 | Average 36.5% |
| Immigrants | Northern Europe | 46.6 /100 | #177 | Average 36.5% |
| Blacks/African Americans | 45.1 /100 | #178 | Average 36.5% |
| Immigrants | Southern Europe | 43.3 /100 | #179 | Average 36.4% |
| Immigrants | Morocco | 41.1 /100 | #180 | Average 36.4% |
| Jordanians | 39.6 /100 | #181 | Fair 36.4% |
| Immigrants | Italy | 39.1 /100 | #182 | Fair 36.4% |
| Eastern Europeans | 38.8 /100 | #183 | Fair 36.4% |
| Costa Ricans | 36.1 /100 | #184 | Fair 36.3% |
Demographics Similar to Africans by In Labor Force | Age 16-19
In terms of in labor force | age 16-19, the demographic groups most similar to Africans are Choctaw (38.0%, a difference of 0.010%), New Zealander (38.0%, a difference of 0.010%), Spaniard (38.0%, a difference of 0.030%), Immigrants from Zimbabwe (38.0%, a difference of 0.060%), and Immigrants from Africa (38.0%, a difference of 0.16%).
| Demographics | Rating | Rank | In Labor Force | Age 16-19 |
| Assyrians/Chaldeans/Syriacs | 97.8 /100 | #119 | Exceptional 38.3% |
| Ukrainians | 97.6 /100 | #120 | Exceptional 38.3% |
| Ethiopians | 97.4 /100 | #121 | Exceptional 38.2% |
| Guamanians/Chamorros | 97.4 /100 | #122 | Exceptional 38.2% |
| Seminole | 96.7 /100 | #123 | Exceptional 38.1% |
| Immigrants | England | 96.4 /100 | #124 | Exceptional 38.1% |
| Immigrants | Africa | 96.1 /100 | #125 | Exceptional 38.0% |
| Africans | 95.6 /100 | #126 | Exceptional 38.0% |
| Choctaw | 95.6 /100 | #127 | Exceptional 38.0% |
| New Zealanders | 95.6 /100 | #128 | Exceptional 38.0% |
| Spaniards | 95.5 /100 | #129 | Exceptional 38.0% |
| Immigrants | Zimbabwe | 95.4 /100 | #130 | Exceptional 38.0% |
| Immigrants | Austria | 95.0 /100 | #131 | Exceptional 37.9% |
| Immigrants | Oceania | 94.7 /100 | #132 | Exceptional 37.9% |
| Cheyenne | 94.6 /100 | #133 | Exceptional 37.9% |