Swedish vs African Poverty

COMPARE

Swedish
Race
Ancestry
AfghanAlaska NativeAlaskan AthabascanAlbanianAleutAlsatianAmericanApacheArabArapahoArgentineanArmenianAssyrian/Chaldean/SyriacAustralianAustrianBahamianBangladeshiBarbadianBasqueBelgianBelizeanBermudanBhutaneseBlackfeetBolivianBrazilianBritishBritish West IndianBulgarianBurmeseCajunCambodianCanadianCape VerdeanCarpatho RusynCelticCentral AmericanCentral American IndianCherokeeCheyenneChickasawChileanChineseChippewaChoctawColombianColvilleComancheCosta RicanCreeCreekCroatianCrowCubanCypriotCzechCzechoslovakianDanishDelawareDominicanDutchDutch West IndianEastern EuropeanEcuadorianEgyptianEnglishEstonianEthiopianEuropeanFijianFilipinoFinnishFrenchFrench American IndianFrench CanadianGermanGerman RussianGhanaianGreekGuamanian/ChamorroGuatemalanGuyaneseHaitianHmongHonduranHopiHoumaHungarianIcelanderIndian (Asian)IndonesianInupiatIranianIraqiIrishIroquoisIsraeliItalianJamaicanJapaneseJordanianKenyanKiowaKoreanLaotianLatvianLebaneseLiberianLithuanianLumbeeLuxembourgerMacedonianMalaysianMalteseMarshalleseMenomineeMexicanMexican American IndianMongolianMoroccanNative HawaiianNavajoNepaleseNew ZealanderNicaraguanNigerianNorthern EuropeanNorwegianOkinawanOsageOttawaPaiutePakistaniPalestinianPanamanianParaguayanPennsylvania GermanPeruvianPimaPolishPortuguesePotawatomiPuebloPuerto RicanPuget Sound SalishRomanianRussianSalvadoranSamoanScandinavianScotch-IrishScottishSeminoleSenegaleseSerbianShoshoneSierra LeoneanSiouxSlavicSlovakSloveneSomaliSouth AfricanSouth AmericanSouth American IndianSoviet UnionSpaniardSpanishSpanish AmericanSpanish American IndianSri LankanSubsaharan AfricanSudaneseSwedishSwissSyrianTaiwaneseThaiTlingit-HaidaTohono O'OdhamTonganTrinidadian and TobagonianTsimshianTurkishU.S. Virgin IslanderUgandanUkrainianUruguayanUteVenezuelanVietnameseWelshWest IndianYakamaYaquiYugoslavianYumanYup'ikZimbabwean
Immigration
NonimmigrantsImmigrantsAfghanistanAfricaAlbaniaArgentinaArmeniaAsiaAustraliaAustriaBahamasBangladeshBarbadosBelarusBelgiumBelizeBoliviaBosnia and HerzegovinaBrazilBulgariaBurma/MyanmarCabo VerdeCambodiaCameroonCanadaCaribbeanCentral AmericaChileChinaColombiaCongoCosta RicaCroatiaCubaCzechoslovakiaDenmarkDominicaDominican RepublicEastern AfricaEastern AsiaEastern EuropeEcuadorEgyptEl SalvadorEnglandEritreaEthiopiaEuropeFijiFranceGermanyGhanaGreeceGrenadaGuatemalaGuyanaHaitiHondurasHong KongHungaryIndiaIndonesiaIranIraqIrelandIsraelItalyJamaicaJapanJordanKazakhstanKenyaKoreaKuwaitLaosLatin AmericaLatviaLebanonLiberiaLithuaniaMalaysiaMexicoMicronesiaMiddle AfricaMoldovaMoroccoNepalNetherlandsNicaraguaNigeriaNorth AmericaNorth MacedoniaNorthern AfricaNorthern EuropeNorwayOceaniaPakistanPanamaPeruPhilippinesPolandPortugalRomaniaRussiaSaudi ArabiaScotlandSenegalSerbiaSierra LeoneSingaporeSomaliaSouth AfricaSouth AmericaSouth Central AsiaSouth Eastern AsiaSouthern EuropeSpainSri LankaSt. Vincent and the GrenadinesSudanSwedenSwitzerlandSyriaTaiwanThailandTrinidad and TobagoTurkeyUgandaUkraineUruguayUzbekistanVenezuelaVietnamWest IndiesWestern AfricaWestern AsiaWestern EuropeYemenZaireZimbabweAzores
African
Race
Ancestry
AfghanAfricanAlaska NativeAlaskan AthabascanAlbanianAleutAlsatianAmericanApacheArabArapahoArgentineanArmenianAssyrian/Chaldean/SyriacAustralianAustrianBahamianBangladeshiBarbadianBasqueBelgianBelizeanBermudanBhutaneseBlackfeetBolivianBrazilianBritishBritish West IndianBulgarianBurmeseCajunCambodianCanadianCape VerdeanCarpatho RusynCelticCentral AmericanCentral American IndianCherokeeCheyenneChickasawChileanChineseChippewaChoctawColombianColvilleComancheCosta RicanCreeCreekCroatianCrowCubanCypriotCzechCzechoslovakianDanishDelawareDominicanDutchDutch West IndianEastern EuropeanEcuadorianEgyptianEnglishEstonianEthiopianEuropeanFijianFilipinoFinnishFrenchFrench American IndianFrench CanadianGermanGerman RussianGhanaianGreekGuamanian/ChamorroGuatemalanGuyaneseHaitianHmongHonduranHopiHoumaHungarianIcelanderIndian (Asian)IndonesianInupiatIranianIraqiIrishIroquoisIsraeliItalianJamaicanJapaneseJordanianKenyanKiowaKoreanLaotianLatvianLebaneseLiberianLithuanianLumbeeLuxembourgerMacedonianMalaysianMalteseMarshalleseMenomineeMexicanMexican American IndianMongolianMoroccanNative HawaiianNavajoNepaleseNew ZealanderNicaraguanNigerianNorthern EuropeanNorwegianOkinawanOsageOttawaPaiutePakistaniPalestinianPanamanianParaguayanPennsylvania GermanPeruvianPimaPolishPortuguesePotawatomiPuebloPuerto RicanPuget Sound SalishRomanianRussianSalvadoranSamoanScandinavianScotch-IrishScottishSeminoleSenegaleseSerbianShoshoneSierra LeoneanSiouxSlavicSlovakSloveneSomaliSouth AfricanSouth AmericanSouth American IndianSoviet UnionSpaniardSpanishSpanish AmericanSpanish American IndianSri LankanSubsaharan AfricanSudaneseSwissSyrianTaiwaneseThaiTlingit-HaidaTohono O'OdhamTonganTrinidadian and TobagonianTsimshianTurkishU.S. Virgin IslanderUgandanUkrainianUruguayanUteVenezuelanVietnameseWelshWest IndianYakamaYaquiYugoslavianYumanYup'ikZimbabwean
Immigration
NonimmigrantsImmigrantsAfghanistanAfricaAlbaniaArgentinaArmeniaAsiaAustraliaAustriaBahamasBangladeshBarbadosBelarusBelgiumBelizeBoliviaBosnia and HerzegovinaBrazilBulgariaBurma/MyanmarCabo VerdeCambodiaCameroonCanadaCaribbeanCentral AmericaChileChinaColombiaCongoCosta RicaCroatiaCubaCzechoslovakiaDenmarkDominicaDominican RepublicEastern AfricaEastern AsiaEastern EuropeEcuadorEgyptEl SalvadorEnglandEritreaEthiopiaEuropeFijiFranceGermanyGhanaGreeceGrenadaGuatemalaGuyanaHaitiHondurasHong KongHungaryIndiaIndonesiaIranIraqIrelandIsraelItalyJamaicaJapanJordanKazakhstanKenyaKoreaKuwaitLaosLatin AmericaLatviaLebanonLiberiaLithuaniaMalaysiaMexicoMicronesiaMiddle AfricaMoldovaMoroccoNepalNetherlandsNicaraguaNigeriaNorth AmericaNorth MacedoniaNorthern AfricaNorthern EuropeNorwayOceaniaPakistanPanamaPeruPhilippinesPolandPortugalRomaniaRussiaSaudi ArabiaScotlandSenegalSerbiaSierra LeoneSingaporeSomaliaSouth AfricaSouth AmericaSouth Central AsiaSouth Eastern AsiaSouthern EuropeSpainSri LankaSt. Vincent and the GrenadinesSudanSwedenSwitzerlandSyriaTaiwanThailandTrinidad and TobagoTurkeyUgandaUkraineUruguayUzbekistanVenezuelaVietnamWest IndiesWestern AfricaWestern AsiaWestern EuropeYemenZaireZimbabweAzores
Poverty
Income
Poverty
Unemployment
Labor Participation
Family Structure
Vehicle Availability
Education Level
Disability

Poverty Comparison

Swedes

Africans

Exceptional
Tragic
10.6%
POVERTY
99.7/ 100
METRIC RATING
23rd/ 347
METRIC RANK
15.6%
POVERTY
0.0/ 100
METRIC RATING
307th/ 347
METRIC RANK

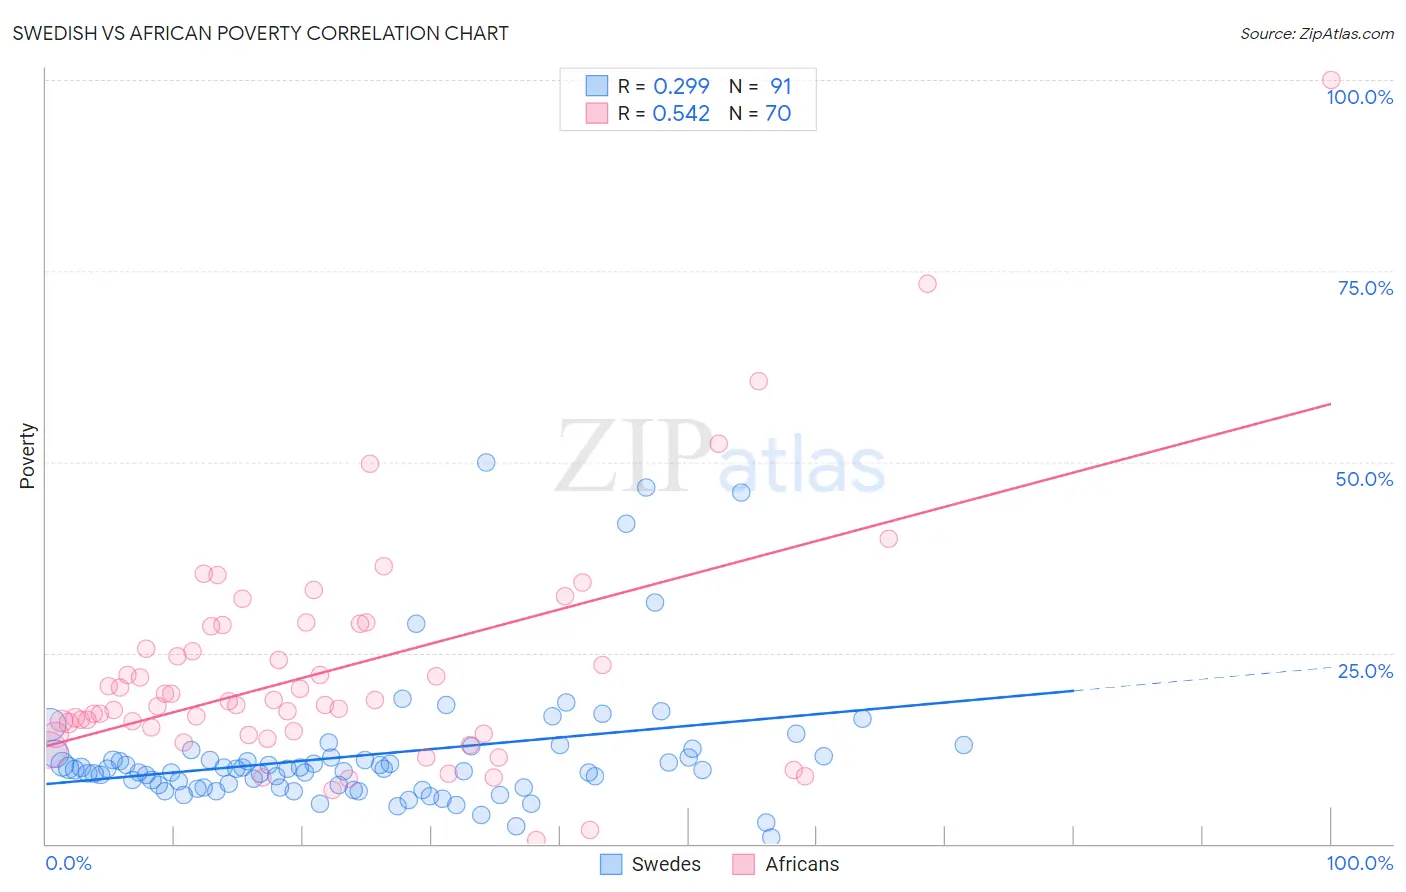
Swedish vs African Poverty Correlation Chart

The statistical analysis conducted on geographies consisting of 538,612,277 people shows a weak positive correlation between the proportion of Swedes and poverty level in the United States with a correlation coefficient (R) of 0.299 and weighted average of 10.6%. Similarly, the statistical analysis conducted on geographies consisting of 469,617,855 people shows a substantial positive correlation between the proportion of Africans and poverty level in the United States with a correlation coefficient (R) of 0.542 and weighted average of 15.6%, a difference of 46.9%.
Swedish vs African Poverty

Poverty Correlation Summary

MeasurementSwedishAfrican
Minimum0.75%0.57%
Maximum50.0%100.0%
Range49.2%99.4%
Mean11.7%22.7%
Median9.7%18.4%
Interquartile 25% (IQ1)7.4%14.4%
Interquartile 75% (IQ3)11.4%28.5%
Interquartile Range (IQR)4.0%14.0%
Standard Deviation (Sample)8.7%15.6%
Standard Deviation (Population)8.7%15.5%

Similar Demographics by Poverty

Demographics Similar to Swedes by Poverty

In terms of poverty, the demographic groups most similar to Swedes are Italian (10.6%, a difference of 0.050%), Eastern European (10.6%, a difference of 0.11%), Croatian (10.6%, a difference of 0.24%), Luxembourger (10.6%, a difference of 0.27%), and Immigrants from North Macedonia (10.6%, a difference of 0.34%).
DemographicsRating | RankPoverty
Lithuanians
99.8
/100
|
#16
Exceptional
10.5%
Norwegians
99.8
/100
|
#17
Exceptional
10.5%
Latvians
99.8
/100
|
#18
Exceptional
10.5%
Immigrants | Scotland
99.7
/100
|
#19
Exceptional
10.6%
Immigrants | North Macedonia
99.7
/100
|
#20
Exceptional
10.6%
Luxembourgers
99.7
/100
|
#21
Exceptional
10.6%
Eastern Europeans
99.7
/100
|
#22
Exceptional
10.6%
Swedes
99.7
/100
|
#23
Exceptional
10.6%
Italians
99.7
/100
|
#24
Exceptional
10.6%
Croatians
99.6
/100
|
#25
Exceptional
10.6%
Burmese
99.6
/100
|
#26
Exceptional
10.7%
Immigrants | Northern Europe
99.6
/100
|
#27
Exceptional
10.7%
Immigrants | Korea
99.5
/100
|
#28
Exceptional
10.7%
Greeks
99.5
/100
|
#29
Exceptional
10.7%
Danes
99.5
/100
|
#30
Exceptional
10.7%

Demographics Similar to Africans by Poverty

In terms of poverty, the demographic groups most similar to Africans are Creek (15.6%, a difference of 0.070%), Choctaw (15.6%, a difference of 0.11%), Seminole (15.6%, a difference of 0.15%), Dutch West Indian (15.6%, a difference of 0.24%), and Immigrants from Guatemala (15.5%, a difference of 0.51%).
DemographicsRating | RankPoverty
Immigrants | Central America
0.0
/100
|
#300
Tragic
15.4%
Bahamians
0.0
/100
|
#301
Tragic
15.4%
Somalis
0.0
/100
|
#302
Tragic
15.4%
Immigrants | Caribbean
0.0
/100
|
#303
Tragic
15.5%
Immigrants | Mexico
0.0
/100
|
#304
Tragic
15.5%
Immigrants | Guatemala
0.0
/100
|
#305
Tragic
15.5%
Creek
0.0
/100
|
#306
Tragic
15.6%
Africans
0.0
/100
|
#307
Tragic
15.6%
Choctaw
0.0
/100
|
#308
Tragic
15.6%
Seminole
0.0
/100
|
#309
Tragic
15.6%
Dutch West Indians
0.0
/100
|
#310
Tragic
15.6%
Chippewa
0.0
/100
|
#311
Tragic
15.7%
Cajuns
0.0
/100
|
#312
Tragic
15.7%
Immigrants | Grenada
0.0
/100
|
#313
Tragic
15.8%
Immigrants | Somalia
0.0
/100
|
#314
Tragic
15.8%