Immigrants from Northern Europe vs African Single Female Poverty
COMPARE
Immigrants from Northern Europe
African
Single Female Poverty
Single Female Poverty Comparison
Immigrants from Northern Europe
Africans
19.2%
SINGLE FEMALE POVERTY
99.6/ 100
METRIC RATING
63rd/ 347
METRIC RANK
24.8%
SINGLE FEMALE POVERTY
0.0/ 100
METRIC RATING
296th/ 347
METRIC RANK
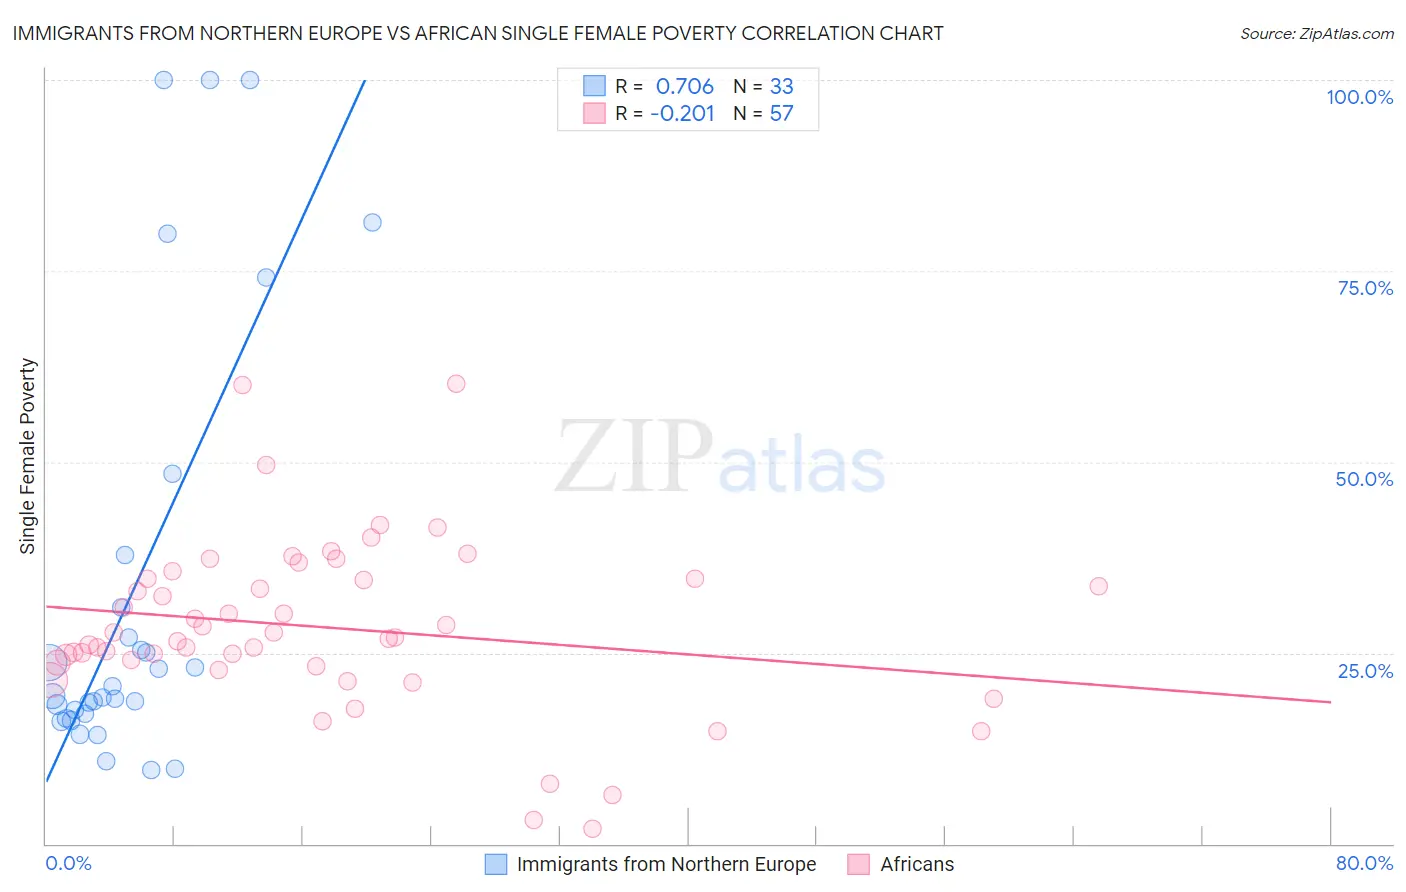
Immigrants from Northern Europe vs African Single Female Poverty Correlation Chart
The statistical analysis conducted on geographies consisting of 465,326,322 people shows a strong positive correlation between the proportion of Immigrants from Northern Europe and poverty level among single females in the United States with a correlation coefficient (R) of 0.706 and weighted average of 19.2%. Similarly, the statistical analysis conducted on geographies consisting of 463,525,497 people shows a weak negative correlation between the proportion of Africans and poverty level among single females in the United States with a correlation coefficient (R) of -0.201 and weighted average of 24.8%, a difference of 28.7%.
Single Female Poverty Correlation Summary
| Measurement | Immigrants from Northern Europe | African |
| Minimum | 9.6% | 1.9% |
| Maximum | 100.0% | 60.3% |
| Range | 90.4% | 58.4% |
| Mean | 33.1% | 28.3% |
| Median | 19.3% | 27.0% |
| Interquartile 25% (IQ1) | 16.7% | 23.4% |
| Interquartile 75% (IQ3) | 34.4% | 34.6% |
| Interquartile Range (IQR) | 17.6% | 11.2% |
| Standard Deviation (Sample) | 28.3% | 11.2% |
| Standard Deviation (Population) | 27.9% | 11.1% |
Similar Demographics by Single Female Poverty
Demographics Similar to Immigrants from Northern Europe by Single Female Poverty
In terms of single female poverty, the demographic groups most similar to Immigrants from Northern Europe are Immigrants from Europe (19.2%, a difference of 0.0%), Cypriot (19.2%, a difference of 0.030%), Palestinian (19.2%, a difference of 0.050%), Immigrants from Egypt (19.2%, a difference of 0.090%), and Lithuanian (19.2%, a difference of 0.12%).
| Demographics | Rating | Rank | Single Female Poverty |
| Immigrants | Fiji | 99.7 /100 | #56 | Exceptional 19.1% |
| Eastern Europeans | 99.7 /100 | #57 | Exceptional 19.1% |
| Immigrants | Bulgaria | 99.7 /100 | #58 | Exceptional 19.1% |
| Sri Lankans | 99.6 /100 | #59 | Exceptional 19.2% |
| Russians | 99.6 /100 | #60 | Exceptional 19.2% |
| Cambodians | 99.6 /100 | #61 | Exceptional 19.2% |
| Lithuanians | 99.6 /100 | #62 | Exceptional 19.2% |
| Immigrants | Northern Europe | 99.6 /100 | #63 | Exceptional 19.2% |
| Immigrants | Europe | 99.6 /100 | #64 | Exceptional 19.2% |
| Cypriots | 99.6 /100 | #65 | Exceptional 19.2% |
| Palestinians | 99.6 /100 | #66 | Exceptional 19.2% |
| Immigrants | Egypt | 99.6 /100 | #67 | Exceptional 19.2% |
| Laotians | 99.5 /100 | #68 | Exceptional 19.3% |
| Paraguayans | 99.5 /100 | #69 | Exceptional 19.3% |
| Immigrants | Jordan | 99.4 /100 | #70 | Exceptional 19.3% |
Demographics Similar to Africans by Single Female Poverty
In terms of single female poverty, the demographic groups most similar to Africans are Immigrants from Central America (24.8%, a difference of 0.28%), Hispanic or Latino (24.6%, a difference of 0.48%), Yaqui (24.9%, a difference of 0.48%), French American Indian (24.6%, a difference of 0.83%), and American (24.5%, a difference of 0.98%).
| Demographics | Rating | Rank | Single Female Poverty |
| U.S. Virgin Islanders | 0.0 /100 | #289 | Tragic 24.2% |
| Indonesians | 0.0 /100 | #290 | Tragic 24.3% |
| Osage | 0.0 /100 | #291 | Tragic 24.4% |
| Alsatians | 0.0 /100 | #292 | Tragic 24.5% |
| Americans | 0.0 /100 | #293 | Tragic 24.5% |
| French American Indians | 0.0 /100 | #294 | Tragic 24.6% |
| Hispanics or Latinos | 0.0 /100 | #295 | Tragic 24.6% |
| Africans | 0.0 /100 | #296 | Tragic 24.8% |
| Immigrants | Central America | 0.0 /100 | #297 | Tragic 24.8% |
| Yaqui | 0.0 /100 | #298 | Tragic 24.9% |
| Mexicans | 0.0 /100 | #299 | Tragic 25.0% |
| Blackfeet | 0.0 /100 | #300 | Tragic 25.1% |
| Hondurans | 0.0 /100 | #301 | Tragic 25.1% |
| Shoshone | 0.0 /100 | #302 | Tragic 25.1% |
| Somalis | 0.0 /100 | #303 | Tragic 25.2% |