Immigrants from Northern Europe vs Nepalese Poverty
COMPARE
Immigrants from Northern Europe
Nepalese
Poverty
Poverty Comparison
Immigrants from Northern Europe
Nepalese
10.7%
POVERTY
99.6/ 100
METRIC RATING
27th/ 347
METRIC RANK
14.0%
POVERTY
0.3/ 100
METRIC RATING
244th/ 347
METRIC RANK
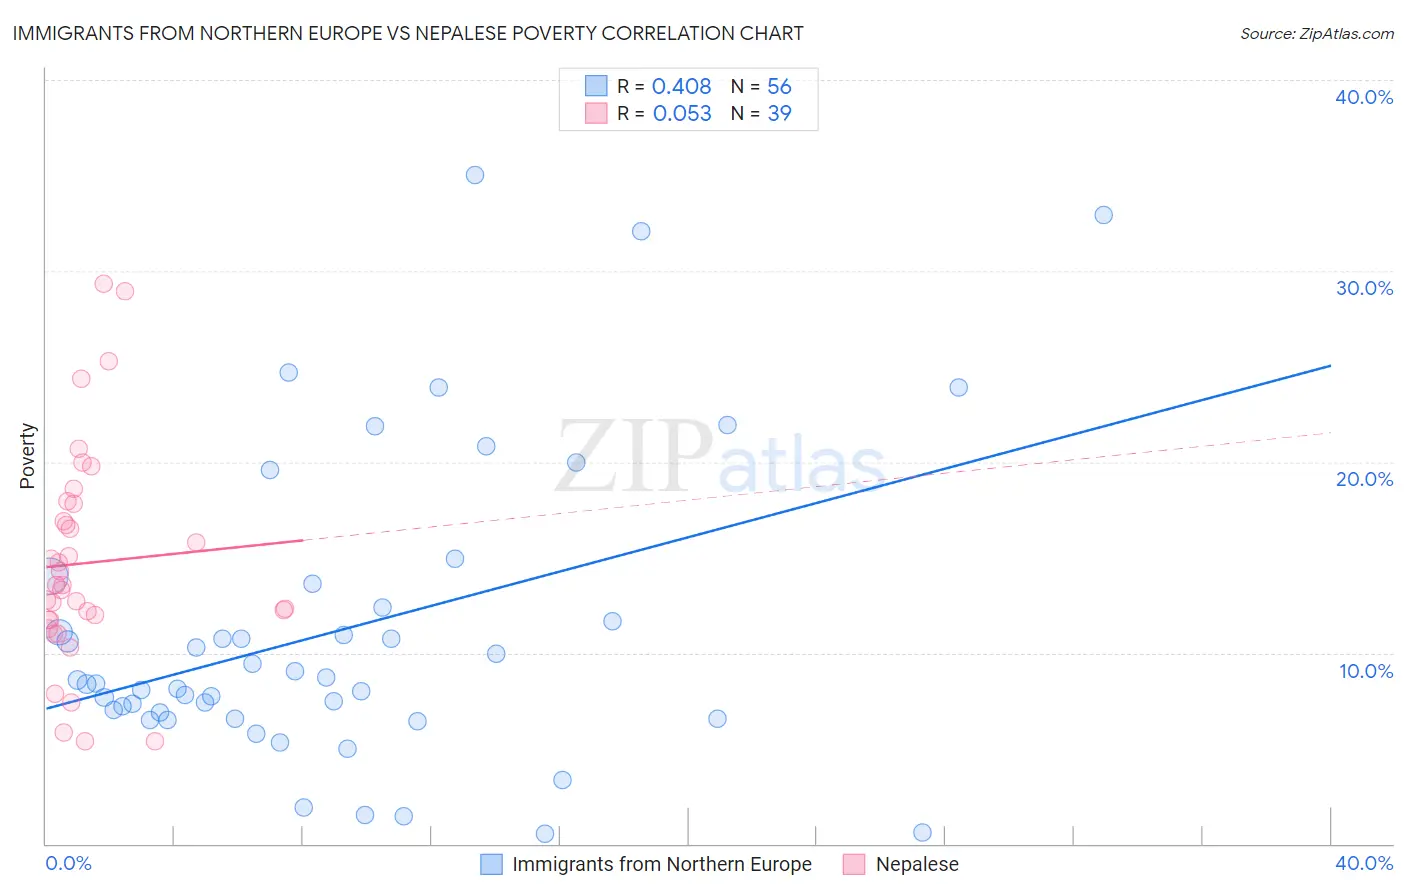
Immigrants from Northern Europe vs Nepalese Poverty Correlation Chart
The statistical analysis conducted on geographies consisting of 476,900,751 people shows a moderate positive correlation between the proportion of Immigrants from Northern Europe and poverty level in the United States with a correlation coefficient (R) of 0.408 and weighted average of 10.7%. Similarly, the statistical analysis conducted on geographies consisting of 24,519,269 people shows a slight positive correlation between the proportion of Nepalese and poverty level in the United States with a correlation coefficient (R) of 0.053 and weighted average of 14.0%, a difference of 30.9%.
Poverty Correlation Summary
| Measurement | Immigrants from Northern Europe | Nepalese |
| Minimum | 0.52% | 5.4% |
| Maximum | 35.0% | 29.3% |
| Range | 34.5% | 23.9% |
| Mean | 11.2% | 14.7% |
| Median | 8.5% | 13.6% |
| Interquartile 25% (IQ1) | 6.7% | 11.7% |
| Interquartile 75% (IQ3) | 13.0% | 17.8% |
| Interquartile Range (IQR) | 6.3% | 6.1% |
| Standard Deviation (Sample) | 7.9% | 5.7% |
| Standard Deviation (Population) | 7.9% | 5.6% |
Similar Demographics by Poverty
Demographics Similar to Immigrants from Northern Europe by Poverty
In terms of poverty, the demographic groups most similar to Immigrants from Northern Europe are Immigrants from Korea (10.7%, a difference of 0.070%), Greek (10.7%, a difference of 0.16%), Danish (10.7%, a difference of 0.17%), Polish (10.7%, a difference of 0.25%), and Iranian (10.7%, a difference of 0.34%).
| Demographics | Rating | Rank | Poverty |
| Immigrants | North Macedonia | 99.7 /100 | #20 | Exceptional 10.6% |
| Luxembourgers | 99.7 /100 | #21 | Exceptional 10.6% |
| Eastern Europeans | 99.7 /100 | #22 | Exceptional 10.6% |
| Swedes | 99.7 /100 | #23 | Exceptional 10.6% |
| Italians | 99.7 /100 | #24 | Exceptional 10.6% |
| Croatians | 99.6 /100 | #25 | Exceptional 10.6% |
| Burmese | 99.6 /100 | #26 | Exceptional 10.7% |
| Immigrants | Northern Europe | 99.6 /100 | #27 | Exceptional 10.7% |
| Immigrants | Korea | 99.5 /100 | #28 | Exceptional 10.7% |
| Greeks | 99.5 /100 | #29 | Exceptional 10.7% |
| Danes | 99.5 /100 | #30 | Exceptional 10.7% |
| Poles | 99.5 /100 | #31 | Exceptional 10.7% |
| Iranians | 99.5 /100 | #32 | Exceptional 10.7% |
| Macedonians | 99.4 /100 | #33 | Exceptional 10.8% |
| Immigrants | Poland | 99.4 /100 | #34 | Exceptional 10.8% |
Demographics Similar to Nepalese by Poverty
In terms of poverty, the demographic groups most similar to Nepalese are Sudanese (14.0%, a difference of 0.030%), Ecuadorian (14.0%, a difference of 0.10%), Immigrants from Sudan (14.1%, a difference of 0.39%), Salvadoran (14.0%, a difference of 0.41%), and Immigrants from Middle Africa (14.0%, a difference of 0.44%).
| Demographics | Rating | Rank | Poverty |
| French American Indians | 0.5 /100 | #237 | Tragic 13.9% |
| Ghanaians | 0.5 /100 | #238 | Tragic 13.9% |
| Nicaraguans | 0.4 /100 | #239 | Tragic 13.9% |
| Immigrants | Middle Africa | 0.4 /100 | #240 | Tragic 14.0% |
| Salvadorans | 0.4 /100 | #241 | Tragic 14.0% |
| Ecuadorians | 0.4 /100 | #242 | Tragic 14.0% |
| Sudanese | 0.3 /100 | #243 | Tragic 14.0% |
| Nepalese | 0.3 /100 | #244 | Tragic 14.0% |
| Immigrants | Sudan | 0.3 /100 | #245 | Tragic 14.1% |
| Potawatomi | 0.3 /100 | #246 | Tragic 14.1% |
| Liberians | 0.2 /100 | #247 | Tragic 14.1% |
| Immigrants | Western Africa | 0.2 /100 | #248 | Tragic 14.1% |
| Immigrants | Ghana | 0.2 /100 | #249 | Tragic 14.2% |
| Cree | 0.2 /100 | #250 | Tragic 14.2% |
| Immigrants | Burma/Myanmar | 0.2 /100 | #251 | Tragic 14.2% |