Immigrants from Northern Europe vs Hmong Poverty
COMPARE
Immigrants from Northern Europe
Hmong
Poverty
Poverty Comparison
Immigrants from Northern Europe
Hmong
10.7%
POVERTY
99.6/ 100
METRIC RATING
27th/ 347
METRIC RANK
12.8%
POVERTY
15.0/ 100
METRIC RATING
203rd/ 347
METRIC RANK
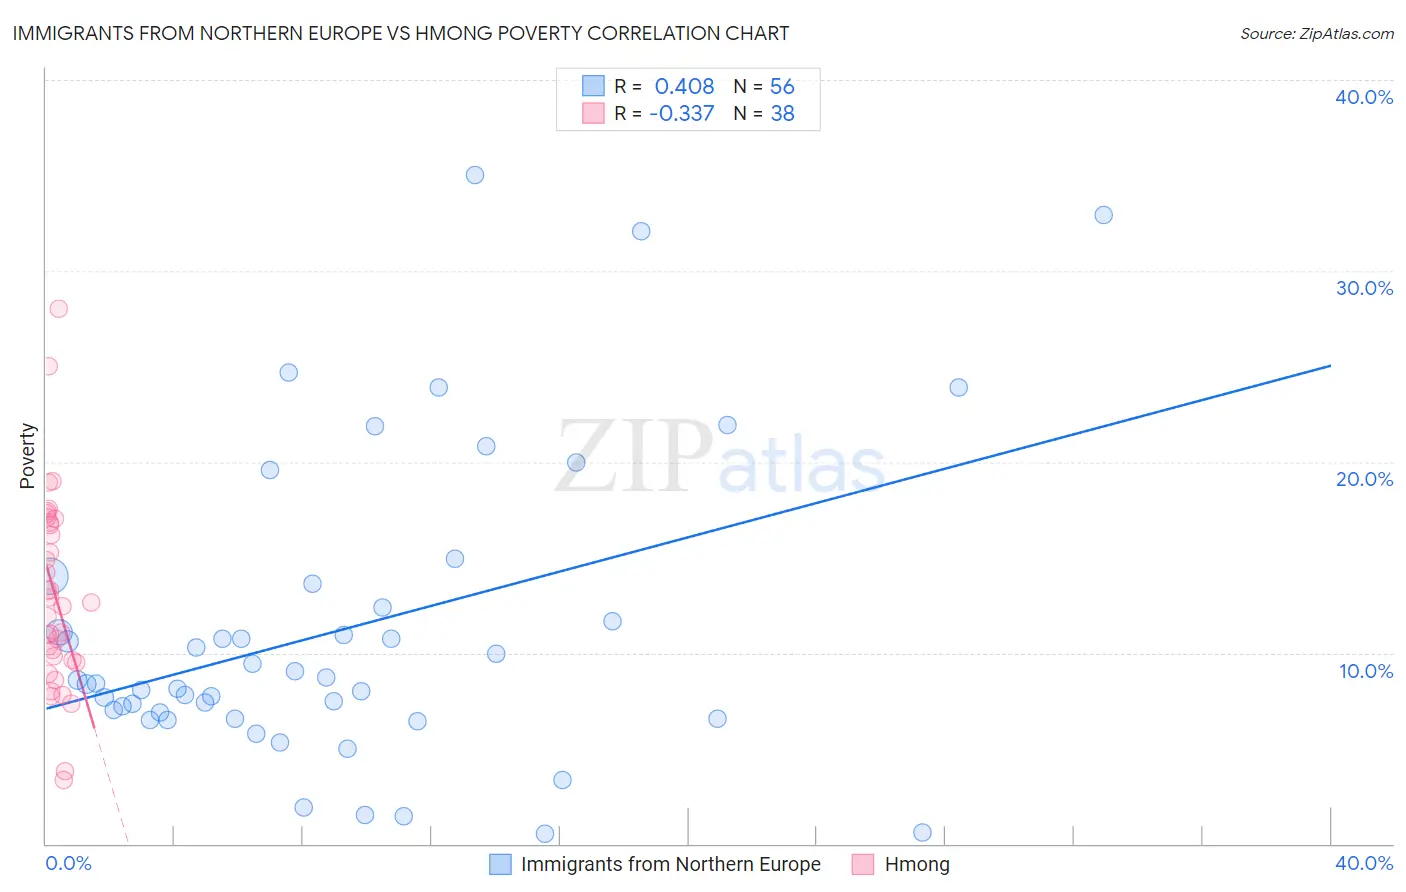
Immigrants from Northern Europe vs Hmong Poverty Correlation Chart
The statistical analysis conducted on geographies consisting of 476,900,751 people shows a moderate positive correlation between the proportion of Immigrants from Northern Europe and poverty level in the United States with a correlation coefficient (R) of 0.408 and weighted average of 10.7%. Similarly, the statistical analysis conducted on geographies consisting of 24,672,093 people shows a mild negative correlation between the proportion of Hmong and poverty level in the United States with a correlation coefficient (R) of -0.337 and weighted average of 12.8%, a difference of 19.9%.
Poverty Correlation Summary
| Measurement | Immigrants from Northern Europe | Hmong |
| Minimum | 0.52% | 3.3% |
| Maximum | 35.0% | 28.0% |
| Range | 34.5% | 24.7% |
| Mean | 11.2% | 13.1% |
| Median | 8.5% | 12.5% |
| Interquartile 25% (IQ1) | 6.7% | 9.6% |
| Interquartile 75% (IQ3) | 13.0% | 16.8% |
| Interquartile Range (IQR) | 6.3% | 7.2% |
| Standard Deviation (Sample) | 7.9% | 5.1% |
| Standard Deviation (Population) | 7.9% | 5.1% |
Similar Demographics by Poverty
Demographics Similar to Immigrants from Northern Europe by Poverty
In terms of poverty, the demographic groups most similar to Immigrants from Northern Europe are Immigrants from Korea (10.7%, a difference of 0.070%), Greek (10.7%, a difference of 0.16%), Danish (10.7%, a difference of 0.17%), Polish (10.7%, a difference of 0.25%), and Iranian (10.7%, a difference of 0.34%).
| Demographics | Rating | Rank | Poverty |
| Immigrants | North Macedonia | 99.7 /100 | #20 | Exceptional 10.6% |
| Luxembourgers | 99.7 /100 | #21 | Exceptional 10.6% |
| Eastern Europeans | 99.7 /100 | #22 | Exceptional 10.6% |
| Swedes | 99.7 /100 | #23 | Exceptional 10.6% |
| Italians | 99.7 /100 | #24 | Exceptional 10.6% |
| Croatians | 99.6 /100 | #25 | Exceptional 10.6% |
| Burmese | 99.6 /100 | #26 | Exceptional 10.7% |
| Immigrants | Northern Europe | 99.6 /100 | #27 | Exceptional 10.7% |
| Immigrants | Korea | 99.5 /100 | #28 | Exceptional 10.7% |
| Greeks | 99.5 /100 | #29 | Exceptional 10.7% |
| Danes | 99.5 /100 | #30 | Exceptional 10.7% |
| Poles | 99.5 /100 | #31 | Exceptional 10.7% |
| Iranians | 99.5 /100 | #32 | Exceptional 10.7% |
| Macedonians | 99.4 /100 | #33 | Exceptional 10.8% |
| Immigrants | Poland | 99.4 /100 | #34 | Exceptional 10.8% |
Demographics Similar to Hmong by Poverty
In terms of poverty, the demographic groups most similar to Hmong are Immigrants from Uruguay (12.8%, a difference of 0.10%), Immigrants from Western Asia (12.9%, a difference of 0.16%), Immigrants from Uganda (12.8%, a difference of 0.26%), Spaniard (12.8%, a difference of 0.27%), and Immigrants from Kenya (12.8%, a difference of 0.42%).
| Demographics | Rating | Rank | Poverty |
| Iraqis | 20.8 /100 | #196 | Fair 12.7% |
| Immigrants | Lebanon | 18.7 /100 | #197 | Poor 12.8% |
| Spanish | 18.7 /100 | #198 | Poor 12.8% |
| Immigrants | Kenya | 17.5 /100 | #199 | Poor 12.8% |
| Spaniards | 16.5 /100 | #200 | Poor 12.8% |
| Immigrants | Uganda | 16.5 /100 | #201 | Poor 12.8% |
| Immigrants | Uruguay | 15.6 /100 | #202 | Poor 12.8% |
| Hmong | 15.0 /100 | #203 | Poor 12.8% |
| Immigrants | Western Asia | 14.1 /100 | #204 | Poor 12.9% |
| Tsimshian | 9.2 /100 | #205 | Tragic 13.0% |
| Immigrants | Eastern Africa | 7.0 /100 | #206 | Tragic 13.1% |
| Panamanians | 6.6 /100 | #207 | Tragic 13.1% |
| Ugandans | 6.2 /100 | #208 | Tragic 13.1% |
| Malaysians | 6.1 /100 | #209 | Tragic 13.1% |
| Immigrants | Azores | 6.1 /100 | #210 | Tragic 13.1% |