Immigrants from Micronesia vs Cheyenne Median Male Earnings
COMPARE
Immigrants from Micronesia
Cheyenne
Median Male Earnings
Median Male Earnings Comparison
Immigrants from Micronesia
Cheyenne
$47,177
MEDIAN MALE EARNINGS
0.1/ 100
METRIC RATING
298th/ 347
METRIC RANK
$46,062
MEDIAN MALE EARNINGS
0.0/ 100
METRIC RATING
318th/ 347
METRIC RANK
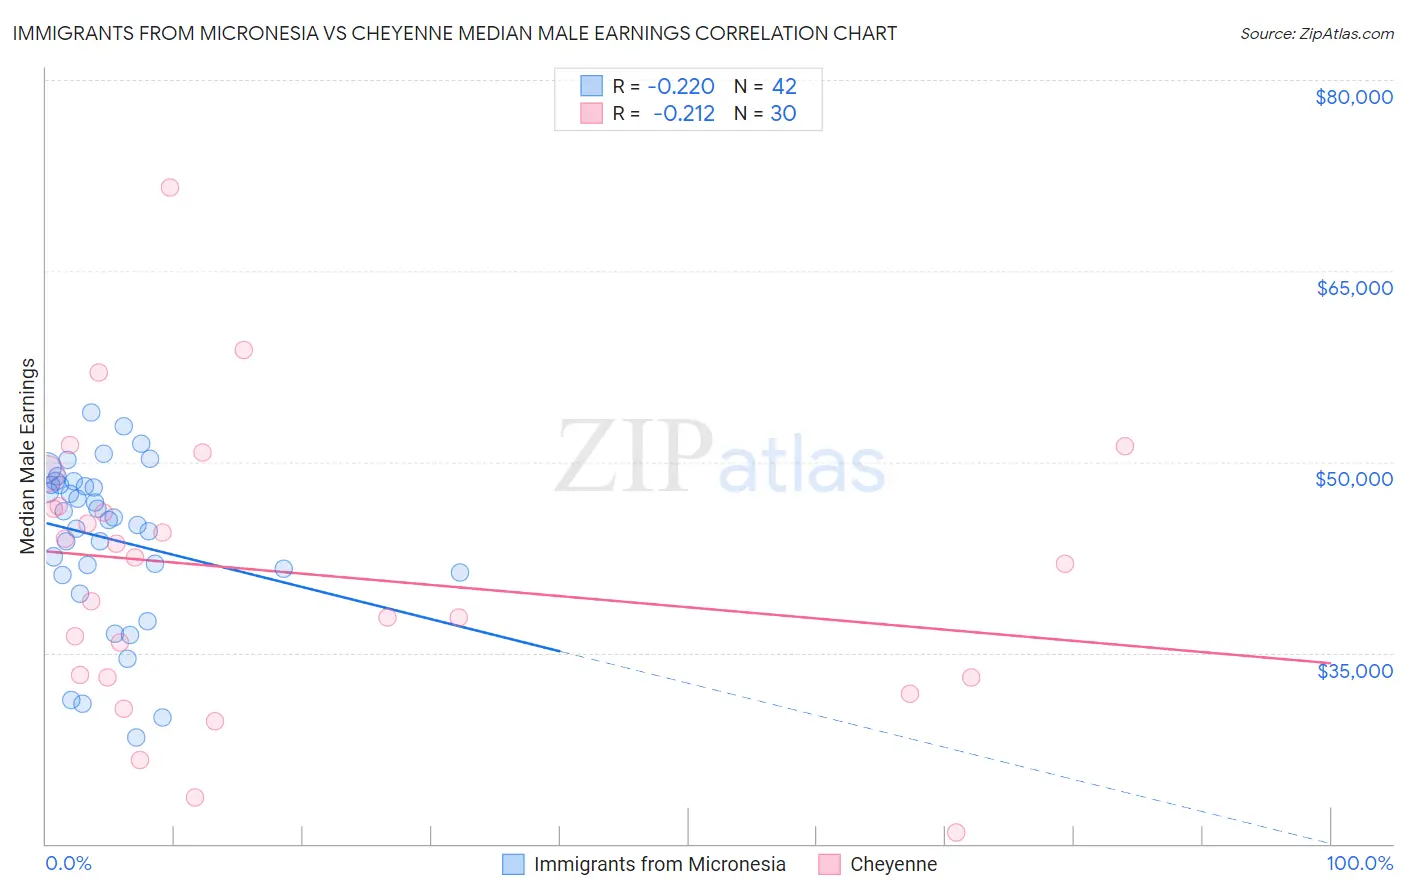
Immigrants from Micronesia vs Cheyenne Median Male Earnings Correlation Chart
The statistical analysis conducted on geographies consisting of 61,605,252 people shows a weak negative correlation between the proportion of Immigrants from Micronesia and median male earnings in the United States with a correlation coefficient (R) of -0.220 and weighted average of $47,177. Similarly, the statistical analysis conducted on geographies consisting of 80,706,071 people shows a weak negative correlation between the proportion of Cheyenne and median male earnings in the United States with a correlation coefficient (R) of -0.212 and weighted average of $46,062, a difference of 2.4%.
Median Male Earnings Correlation Summary
| Measurement | Immigrants from Micronesia | Cheyenne |
| Minimum | $28,299 | $20,903 |
| Maximum | $53,866 | $71,550 |
| Range | $25,567 | $50,647 |
| Mean | $43,968 | $41,316 |
| Median | $45,525 | $42,260 |
| Interquartile 25% (IQ1) | $41,333 | $33,100 |
| Interquartile 75% (IQ3) | $48,203 | $46,481 |
| Interquartile Range (IQR) | $6,870 | $13,381 |
| Standard Deviation (Sample) | $6,332 | $10,984 |
| Standard Deviation (Population) | $6,257 | $10,799 |
Demographics Similar to Immigrants from Micronesia and Cheyenne by Median Male Earnings
In terms of median male earnings, the demographic groups most similar to Immigrants from Micronesia are Immigrants from Zaire ($47,070, a difference of 0.23%), U.S. Virgin Islander ($47,066, a difference of 0.23%), Immigrants from Latin America ($46,941, a difference of 0.50%), Seminole ($46,783, a difference of 0.84%), and Yaqui ($46,777, a difference of 0.85%). Similarly, the demographic groups most similar to Cheyenne are Mexican ($46,147, a difference of 0.18%), Immigrants from Caribbean ($46,193, a difference of 0.28%), Immigrants from Guatemala ($46,244, a difference of 0.39%), Chippewa ($46,368, a difference of 0.66%), and Honduran ($46,374, a difference of 0.68%).
| Demographics | Rating | Rank | Median Male Earnings |
| Immigrants | Micronesia | 0.1 /100 | #298 | Tragic $47,177 |
| Immigrants | Zaire | 0.1 /100 | #299 | Tragic $47,070 |
| U.S. Virgin Islanders | 0.1 /100 | #300 | Tragic $47,066 |
| Immigrants | Latin America | 0.1 /100 | #301 | Tragic $46,941 |
| Seminole | 0.1 /100 | #302 | Tragic $46,783 |
| Yaqui | 0.1 /100 | #303 | Tragic $46,777 |
| Bangladeshis | 0.1 /100 | #304 | Tragic $46,744 |
| Guatemalans | 0.0 /100 | #305 | Tragic $46,736 |
| Dutch West Indians | 0.0 /100 | #306 | Tragic $46,656 |
| Immigrants | Dominican Republic | 0.0 /100 | #307 | Tragic $46,655 |
| Ottawa | 0.0 /100 | #308 | Tragic $46,611 |
| Creek | 0.0 /100 | #309 | Tragic $46,594 |
| Cubans | 0.0 /100 | #310 | Tragic $46,580 |
| Apache | 0.0 /100 | #311 | Tragic $46,429 |
| Hispanics or Latinos | 0.0 /100 | #312 | Tragic $46,419 |
| Hondurans | 0.0 /100 | #313 | Tragic $46,374 |
| Chippewa | 0.0 /100 | #314 | Tragic $46,368 |
| Immigrants | Guatemala | 0.0 /100 | #315 | Tragic $46,244 |
| Immigrants | Caribbean | 0.0 /100 | #316 | Tragic $46,193 |
| Mexicans | 0.0 /100 | #317 | Tragic $46,147 |
| Cheyenne | 0.0 /100 | #318 | Tragic $46,062 |