Immigrants from Latvia vs Uruguayan Single Mother Households
COMPARE
Immigrants from Latvia
Uruguayan
Single Mother Households
Single Mother Households Comparison
Immigrants from Latvia
Uruguayans
5.5%
SINGLE MOTHER HOUSEHOLDS
99.2/ 100
METRIC RATING
49th/ 347
METRIC RANK
6.6%
SINGLE MOTHER HOUSEHOLDS
18.0/ 100
METRIC RATING
196th/ 347
METRIC RANK
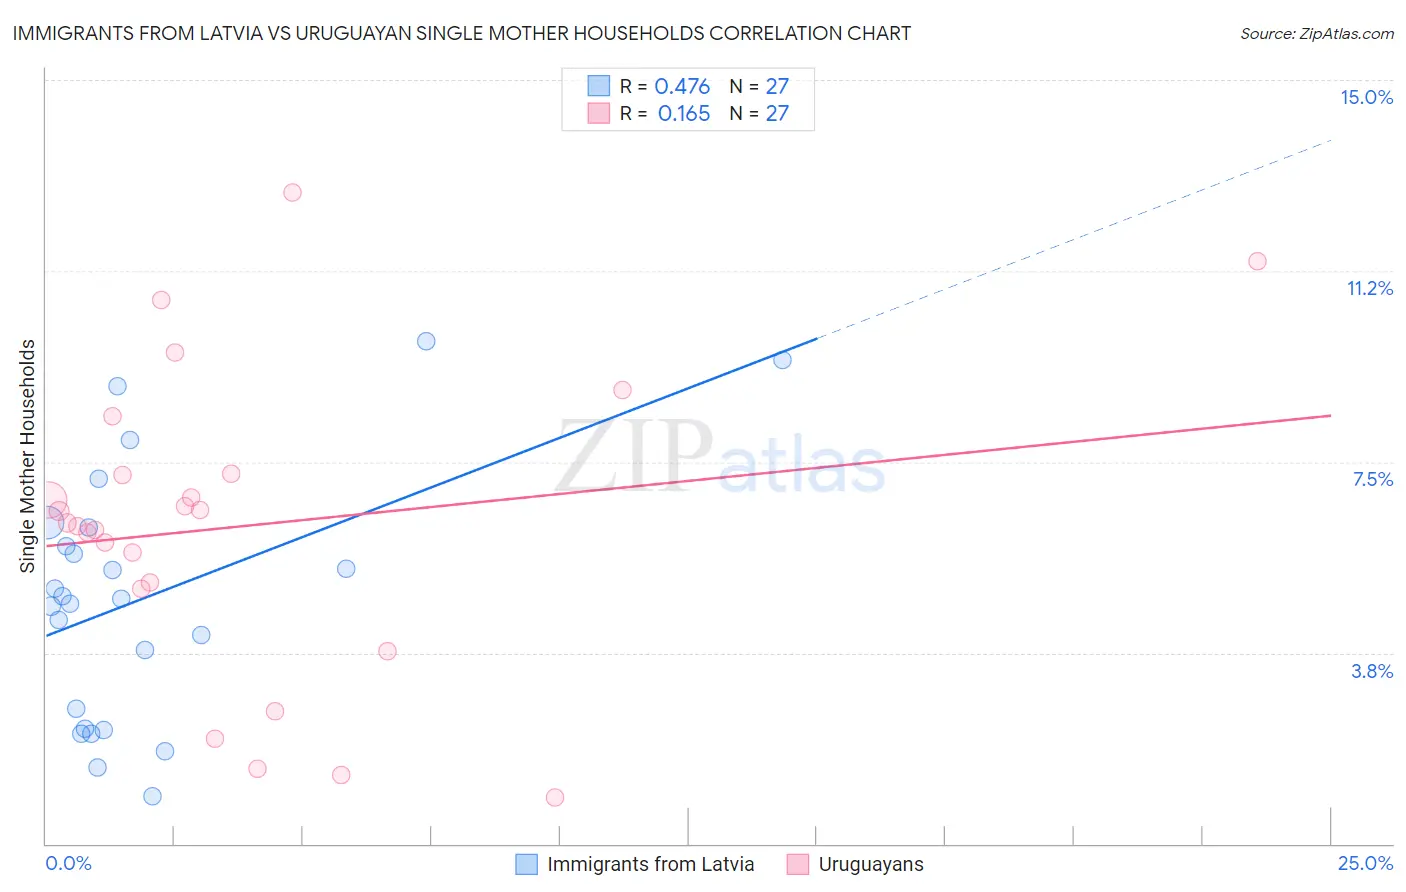
Immigrants from Latvia vs Uruguayan Single Mother Households Correlation Chart
The statistical analysis conducted on geographies consisting of 113,660,661 people shows a moderate positive correlation between the proportion of Immigrants from Latvia and percentage of single mother households in the United States with a correlation coefficient (R) of 0.476 and weighted average of 5.5%. Similarly, the statistical analysis conducted on geographies consisting of 144,678,091 people shows a poor positive correlation between the proportion of Uruguayans and percentage of single mother households in the United States with a correlation coefficient (R) of 0.165 and weighted average of 6.6%, a difference of 20.0%.
Single Mother Households Correlation Summary
| Measurement | Immigrants from Latvia | Uruguayan |
| Minimum | 0.94% | 0.91% |
| Maximum | 9.9% | 12.8% |
| Range | 8.9% | 11.9% |
| Mean | 4.8% | 6.2% |
| Median | 4.8% | 6.3% |
| Interquartile 25% (IQ1) | 2.3% | 5.0% |
| Interquartile 75% (IQ3) | 6.2% | 7.3% |
| Interquartile Range (IQR) | 4.0% | 2.3% |
| Standard Deviation (Sample) | 2.4% | 3.0% |
| Standard Deviation (Population) | 2.4% | 2.9% |
Similar Demographics by Single Mother Households
Demographics Similar to Immigrants from Latvia by Single Mother Households
In terms of single mother households, the demographic groups most similar to Immigrants from Latvia are Turkish (5.5%, a difference of 0.030%), Immigrants from Scotland (5.5%, a difference of 0.19%), Immigrants from Belarus (5.5%, a difference of 0.21%), Norwegian (5.5%, a difference of 0.23%), and Swedish (5.5%, a difference of 0.27%).
| Demographics | Rating | Rank | Single Mother Households |
| Macedonians | 99.5 /100 | #42 | Exceptional 5.4% |
| Immigrants | South Central Asia | 99.5 /100 | #43 | Exceptional 5.4% |
| Lithuanians | 99.4 /100 | #44 | Exceptional 5.4% |
| Immigrants | Croatia | 99.4 /100 | #45 | Exceptional 5.4% |
| Croatians | 99.3 /100 | #46 | Exceptional 5.5% |
| Norwegians | 99.3 /100 | #47 | Exceptional 5.5% |
| Turks | 99.2 /100 | #48 | Exceptional 5.5% |
| Immigrants | Latvia | 99.2 /100 | #49 | Exceptional 5.5% |
| Immigrants | Scotland | 99.2 /100 | #50 | Exceptional 5.5% |
| Immigrants | Belarus | 99.2 /100 | #51 | Exceptional 5.5% |
| Swedes | 99.1 /100 | #52 | Exceptional 5.5% |
| Immigrants | Russia | 99.1 /100 | #53 | Exceptional 5.5% |
| Immigrants | Lebanon | 99.1 /100 | #54 | Exceptional 5.5% |
| Immigrants | Denmark | 99.1 /100 | #55 | Exceptional 5.5% |
| Immigrants | Romania | 99.0 /100 | #56 | Exceptional 5.5% |
Demographics Similar to Uruguayans by Single Mother Households
In terms of single mother households, the demographic groups most similar to Uruguayans are South American (6.6%, a difference of 0.0%), Colombian (6.6%, a difference of 0.050%), Immigrants from Uganda (6.6%, a difference of 0.050%), Moroccan (6.6%, a difference of 0.11%), and American (6.6%, a difference of 0.17%).
| Demographics | Rating | Rank | Single Mother Households |
| Delaware | 23.3 /100 | #189 | Fair 6.5% |
| Peruvians | 21.6 /100 | #190 | Fair 6.5% |
| Samoans | 21.2 /100 | #191 | Fair 6.5% |
| Americans | 19.0 /100 | #192 | Poor 6.6% |
| Colombians | 18.3 /100 | #193 | Poor 6.6% |
| Immigrants | Uganda | 18.3 /100 | #194 | Poor 6.6% |
| South Americans | 18.0 /100 | #195 | Poor 6.6% |
| Uruguayans | 18.0 /100 | #196 | Poor 6.6% |
| Moroccans | 17.4 /100 | #197 | Poor 6.6% |
| Hawaiians | 16.1 /100 | #198 | Poor 6.6% |
| Potawatomi | 15.5 /100 | #199 | Poor 6.6% |
| Immigrants | Ethiopia | 14.7 /100 | #200 | Poor 6.6% |
| Venezuelans | 12.9 /100 | #201 | Poor 6.6% |
| Guamanians/Chamorros | 12.4 /100 | #202 | Poor 6.6% |
| Immigrants | Peru | 12.0 /100 | #203 | Poor 6.7% |