Spaniard vs South American Indian Female Poverty
COMPARE
Spaniard
South American Indian
Female Poverty
Female Poverty Comparison
Spaniards
South American Indians
13.9%
FEMALE POVERTY
18.9/ 100
METRIC RATING
204th/ 347
METRIC RANK
13.7%
FEMALE POVERTY
28.9/ 100
METRIC RATING
196th/ 347
METRIC RANK
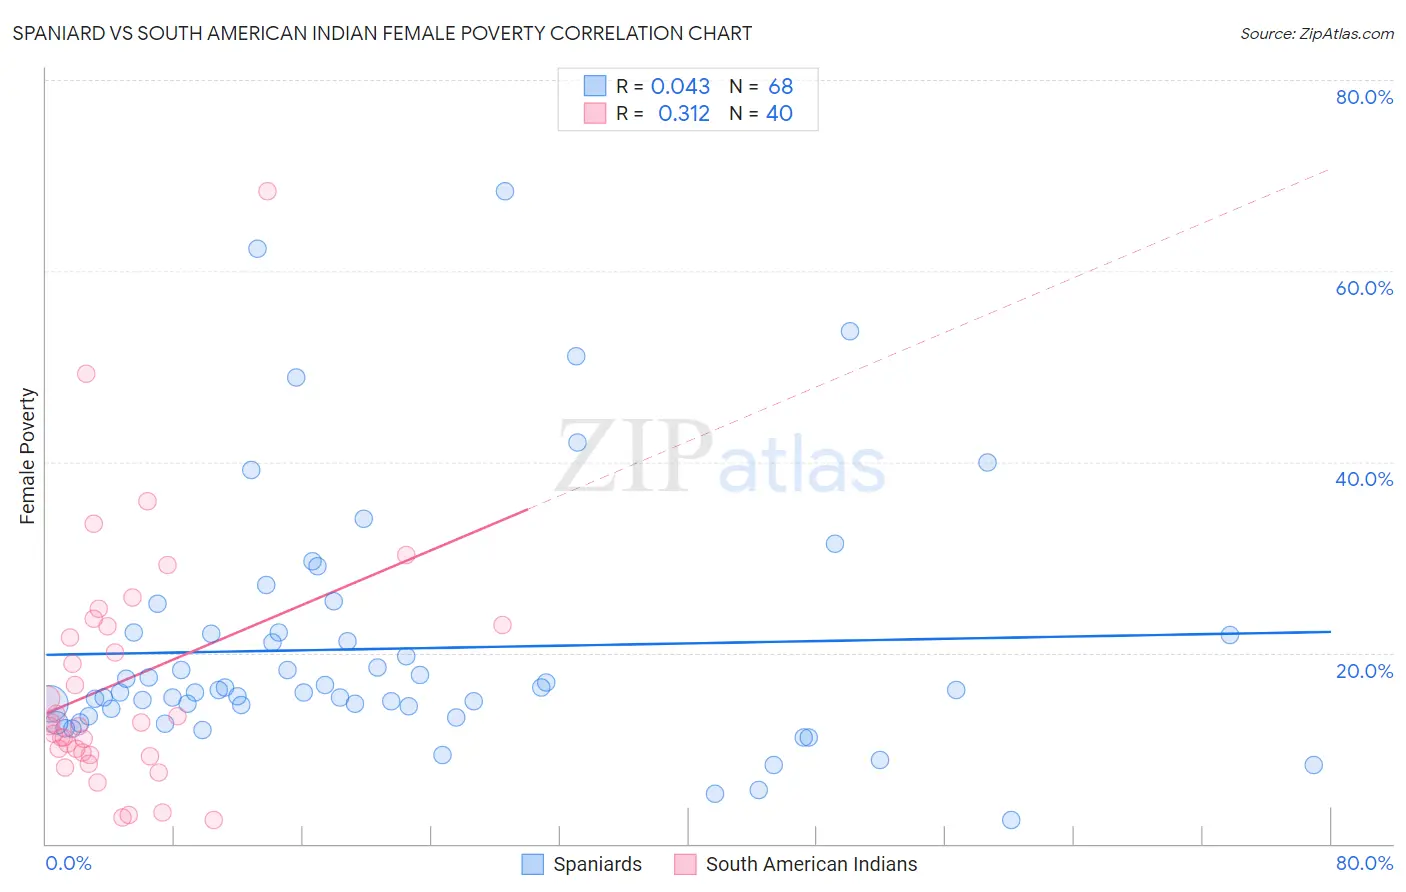
Spaniard vs South American Indian Female Poverty Correlation Chart
The statistical analysis conducted on geographies consisting of 443,063,734 people shows no correlation between the proportion of Spaniards and poverty level among females in the United States with a correlation coefficient (R) of 0.043 and weighted average of 13.9%. Similarly, the statistical analysis conducted on geographies consisting of 164,514,214 people shows a mild positive correlation between the proportion of South American Indians and poverty level among females in the United States with a correlation coefficient (R) of 0.312 and weighted average of 13.7%, a difference of 1.3%.
Female Poverty Correlation Summary
| Measurement | Spaniard | South American Indian |
| Minimum | 2.5% | 2.4% |
| Maximum | 68.3% | 68.3% |
| Range | 65.9% | 65.9% |
| Mean | 20.4% | 17.0% |
| Median | 15.9% | 12.5% |
| Interquartile 25% (IQ1) | 13.8% | 9.4% |
| Interquartile 75% (IQ3) | 22.0% | 22.8% |
| Interquartile Range (IQR) | 8.3% | 13.4% |
| Standard Deviation (Sample) | 13.0% | 13.0% |
| Standard Deviation (Population) | 12.9% | 12.9% |
Demographics Similar to Spaniards and South American Indians by Female Poverty
In terms of female poverty, the demographic groups most similar to Spaniards are Immigrants from Western Asia (13.9%, a difference of 0.27%), Hmong (13.9%, a difference of 0.32%), Immigrants from Kenya (13.9%, a difference of 0.33%), Spanish (13.9%, a difference of 0.37%), and Ugandan (14.0%, a difference of 0.56%). Similarly, the demographic groups most similar to South American Indians are Arab (13.7%, a difference of 0.040%), Immigrants from Uganda (13.7%, a difference of 0.060%), Immigrants from South America (13.7%, a difference of 0.19%), Delaware (13.7%, a difference of 0.25%), and Iraqi (13.7%, a difference of 0.31%).
| Demographics | Rating | Rank | Female Poverty |
| Sierra Leoneans | 33.1 /100 | #190 | Fair 13.7% |
| Immigrants | Kuwait | 32.7 /100 | #191 | Fair 13.7% |
| Immigrants | Costa Rica | 31.9 /100 | #192 | Fair 13.7% |
| Iraqis | 31.8 /100 | #193 | Fair 13.7% |
| Delaware | 31.1 /100 | #194 | Fair 13.7% |
| Immigrants | South America | 30.6 /100 | #195 | Fair 13.7% |
| South American Indians | 28.9 /100 | #196 | Fair 13.7% |
| Arabs | 28.6 /100 | #197 | Fair 13.7% |
| Immigrants | Uganda | 28.5 /100 | #198 | Fair 13.7% |
| Immigrants | Lebanon | 25.6 /100 | #199 | Fair 13.8% |
| Spanish | 21.4 /100 | #200 | Fair 13.9% |
| Immigrants | Kenya | 21.1 /100 | #201 | Fair 13.9% |
| Hmong | 21.1 /100 | #202 | Fair 13.9% |
| Immigrants | Western Asia | 20.7 /100 | #203 | Fair 13.9% |
| Spaniards | 18.9 /100 | #204 | Poor 13.9% |
| Ugandans | 15.4 /100 | #205 | Poor 14.0% |
| Immigrants | Uruguay | 14.0 /100 | #206 | Poor 14.0% |
| Immigrants | Eastern Africa | 9.0 /100 | #207 | Tragic 14.2% |
| Immigrants | Azores | 7.9 /100 | #208 | Tragic 14.2% |
| Panamanians | 7.7 /100 | #209 | Tragic 14.2% |
| Malaysians | 7.4 /100 | #210 | Tragic 14.3% |