Immigrants from Eritrea vs Shoshone Female Poverty
COMPARE
Immigrants from Eritrea
Shoshone
Female Poverty
Female Poverty Comparison
Immigrants from Eritrea
Shoshone
14.6%
FEMALE POVERTY
2.4/ 100
METRIC RATING
226th/ 347
METRIC RANK
15.6%
FEMALE POVERTY
0.1/ 100
METRIC RATING
258th/ 347
METRIC RANK
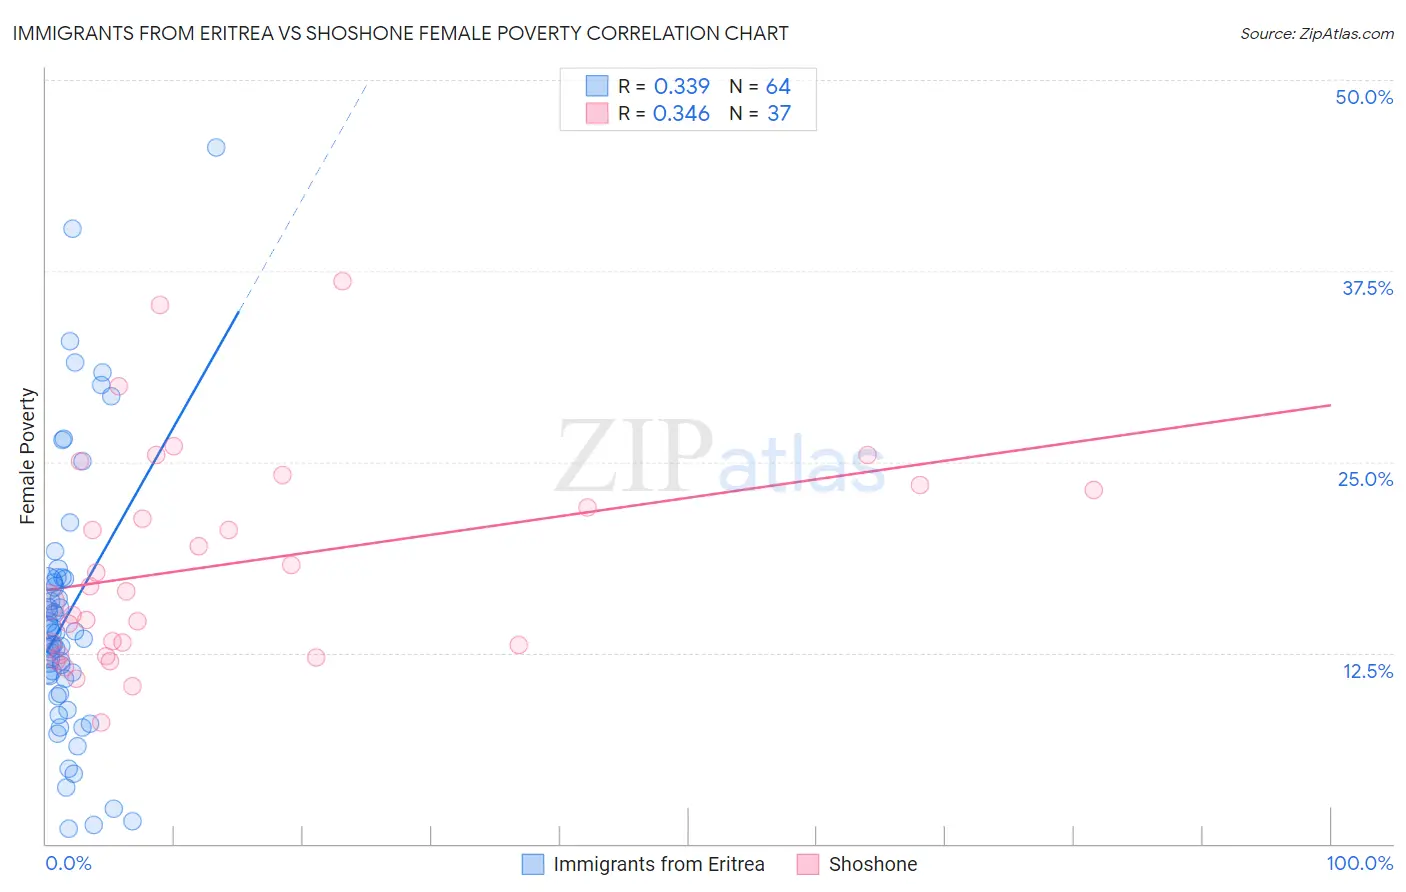
Immigrants from Eritrea vs Shoshone Female Poverty Correlation Chart
The statistical analysis conducted on geographies consisting of 104,846,826 people shows a mild positive correlation between the proportion of Immigrants from Eritrea and poverty level among females in the United States with a correlation coefficient (R) of 0.339 and weighted average of 14.6%. Similarly, the statistical analysis conducted on geographies consisting of 66,611,766 people shows a mild positive correlation between the proportion of Shoshone and poverty level among females in the United States with a correlation coefficient (R) of 0.346 and weighted average of 15.6%, a difference of 6.3%.
Female Poverty Correlation Summary
| Measurement | Immigrants from Eritrea | Shoshone |
| Minimum | 1.0% | 8.0% |
| Maximum | 45.6% | 36.8% |
| Range | 44.6% | 28.9% |
| Mean | 15.0% | 18.3% |
| Median | 13.6% | 16.6% |
| Interquartile 25% (IQ1) | 10.3% | 12.7% |
| Interquartile 75% (IQ3) | 17.2% | 23.3% |
| Interquartile Range (IQR) | 6.9% | 10.7% |
| Standard Deviation (Sample) | 8.9% | 6.9% |
| Standard Deviation (Population) | 8.8% | 6.8% |
Similar Demographics by Female Poverty
Demographics Similar to Immigrants from Eritrea by Female Poverty
In terms of female poverty, the demographic groups most similar to Immigrants from Eritrea are Immigrants from Nigeria (14.7%, a difference of 0.31%), American (14.6%, a difference of 0.33%), Immigrants from Micronesia (14.6%, a difference of 0.33%), German Russian (14.7%, a difference of 0.45%), and Ghanaian (14.7%, a difference of 0.52%).
| Demographics | Rating | Rank | Female Poverty |
| Japanese | 4.1 /100 | #219 | Tragic 14.5% |
| Alsatians | 4.0 /100 | #220 | Tragic 14.5% |
| Immigrants | Cambodia | 3.7 /100 | #221 | Tragic 14.5% |
| Immigrants | Nonimmigrants | 3.7 /100 | #222 | Tragic 14.5% |
| Immigrants | Africa | 3.3 /100 | #223 | Tragic 14.5% |
| Americans | 2.8 /100 | #224 | Tragic 14.6% |
| Immigrants | Micronesia | 2.8 /100 | #225 | Tragic 14.6% |
| Immigrants | Eritrea | 2.4 /100 | #226 | Tragic 14.6% |
| Immigrants | Nigeria | 2.1 /100 | #227 | Tragic 14.7% |
| German Russians | 2.0 /100 | #228 | Tragic 14.7% |
| Ghanaians | 1.9 /100 | #229 | Tragic 14.7% |
| Alaska Natives | 1.8 /100 | #230 | Tragic 14.7% |
| Nigerians | 1.7 /100 | #231 | Tragic 14.8% |
| Osage | 1.5 /100 | #232 | Tragic 14.8% |
| Immigrants | Saudi Arabia | 1.4 /100 | #233 | Tragic 14.8% |
Demographics Similar to Shoshone by Female Poverty
In terms of female poverty, the demographic groups most similar to Shoshone are Immigrants from Jamaica (15.6%, a difference of 0.060%), Cape Verdean (15.6%, a difference of 0.12%), Jamaican (15.5%, a difference of 0.19%), Immigrants from Guyana (15.6%, a difference of 0.19%), and Guyanese (15.6%, a difference of 0.29%).
| Demographics | Rating | Rank | Female Poverty |
| Immigrants | Trinidad and Tobago | 0.3 /100 | #251 | Tragic 15.4% |
| Immigrants | Burma/Myanmar | 0.3 /100 | #252 | Tragic 15.4% |
| Liberians | 0.2 /100 | #253 | Tragic 15.4% |
| Trinidadians and Tobagonians | 0.2 /100 | #254 | Tragic 15.4% |
| Ottawa | 0.2 /100 | #255 | Tragic 15.5% |
| Jamaicans | 0.2 /100 | #256 | Tragic 15.5% |
| Immigrants | Jamaica | 0.1 /100 | #257 | Tragic 15.6% |
| Shoshone | 0.1 /100 | #258 | Tragic 15.6% |
| Cape Verdeans | 0.1 /100 | #259 | Tragic 15.6% |
| Immigrants | Guyana | 0.1 /100 | #260 | Tragic 15.6% |
| Guyanese | 0.1 /100 | #261 | Tragic 15.6% |
| Mexican American Indians | 0.1 /100 | #262 | Tragic 15.6% |
| Cherokee | 0.1 /100 | #263 | Tragic 15.6% |
| Immigrants | Ecuador | 0.1 /100 | #264 | Tragic 15.6% |
| Immigrants | Liberia | 0.1 /100 | #265 | Tragic 15.7% |