Immigrants from Fiji vs Shoshone Female Poverty
COMPARE
Immigrants from Fiji
Shoshone
Female Poverty
Female Poverty Comparison
Immigrants from Fiji
Shoshone
13.2%
FEMALE POVERTY
71.0/ 100
METRIC RATING
153rd/ 347
METRIC RANK
15.6%
FEMALE POVERTY
0.1/ 100
METRIC RATING
258th/ 347
METRIC RANK
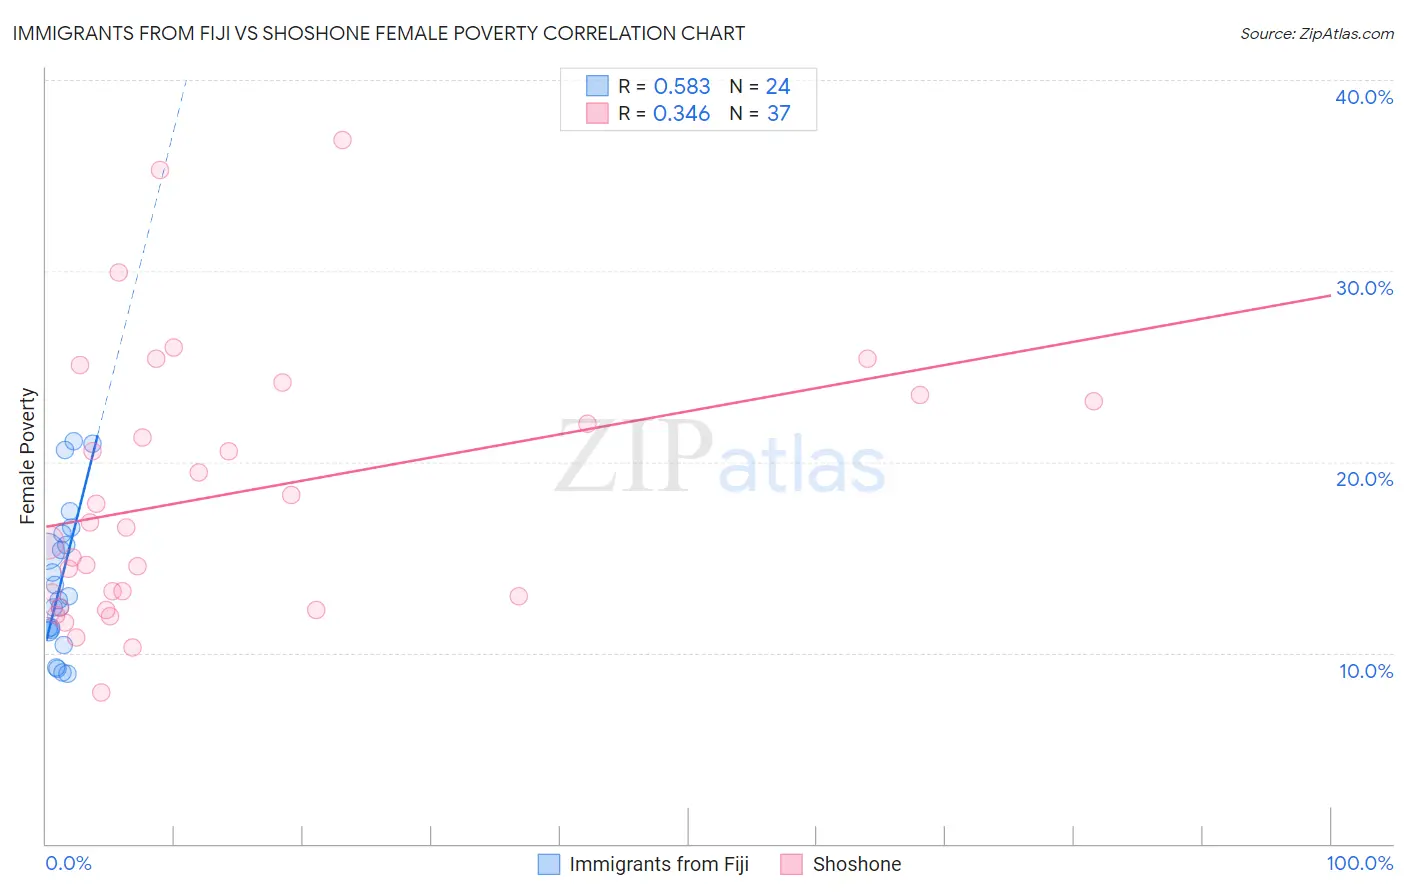
Immigrants from Fiji vs Shoshone Female Poverty Correlation Chart
The statistical analysis conducted on geographies consisting of 93,754,712 people shows a substantial positive correlation between the proportion of Immigrants from Fiji and poverty level among females in the United States with a correlation coefficient (R) of 0.583 and weighted average of 13.2%. Similarly, the statistical analysis conducted on geographies consisting of 66,611,766 people shows a mild positive correlation between the proportion of Shoshone and poverty level among females in the United States with a correlation coefficient (R) of 0.346 and weighted average of 15.6%, a difference of 18.3%.
Female Poverty Correlation Summary
| Measurement | Immigrants from Fiji | Shoshone |
| Minimum | 8.9% | 8.0% |
| Maximum | 21.1% | 36.8% |
| Range | 12.2% | 28.9% |
| Mean | 13.7% | 18.3% |
| Median | 12.9% | 16.6% |
| Interquartile 25% (IQ1) | 11.2% | 12.7% |
| Interquartile 75% (IQ3) | 16.0% | 23.3% |
| Interquartile Range (IQR) | 4.8% | 10.7% |
| Standard Deviation (Sample) | 3.7% | 6.9% |
| Standard Deviation (Population) | 3.7% | 6.8% |
Similar Demographics by Female Poverty
Demographics Similar to Immigrants from Fiji by Female Poverty
In terms of female poverty, the demographic groups most similar to Immigrants from Fiji are Armenian (13.2%, a difference of 0.070%), Hungarian (13.2%, a difference of 0.10%), Immigrants from Bosnia and Herzegovina (13.2%, a difference of 0.15%), Immigrants from Northern Africa (13.2%, a difference of 0.25%), and Samoan (13.1%, a difference of 0.32%).
| Demographics | Rating | Rank | Female Poverty |
| Immigrants | Peru | 79.1 /100 | #146 | Good 13.0% |
| Immigrants | Kazakhstan | 78.6 /100 | #147 | Good 13.0% |
| Yugoslavians | 76.9 /100 | #148 | Good 13.1% |
| Taiwanese | 75.7 /100 | #149 | Good 13.1% |
| Tsimshian | 75.5 /100 | #150 | Good 13.1% |
| Immigrants | Germany | 74.9 /100 | #151 | Good 13.1% |
| Samoans | 73.6 /100 | #152 | Good 13.1% |
| Immigrants | Fiji | 71.0 /100 | #153 | Good 13.2% |
| Armenians | 70.4 /100 | #154 | Good 13.2% |
| Hungarians | 70.1 /100 | #155 | Good 13.2% |
| Immigrants | Bosnia and Herzegovina | 69.7 /100 | #156 | Good 13.2% |
| Immigrants | Northern Africa | 68.8 /100 | #157 | Good 13.2% |
| Pennsylvania Germans | 67.3 /100 | #158 | Good 13.2% |
| Costa Ricans | 63.6 /100 | #159 | Good 13.3% |
| Immigrants | Nepal | 62.7 /100 | #160 | Good 13.3% |
Demographics Similar to Shoshone by Female Poverty
In terms of female poverty, the demographic groups most similar to Shoshone are Immigrants from Jamaica (15.6%, a difference of 0.060%), Cape Verdean (15.6%, a difference of 0.12%), Jamaican (15.5%, a difference of 0.19%), Immigrants from Guyana (15.6%, a difference of 0.19%), and Guyanese (15.6%, a difference of 0.29%).
| Demographics | Rating | Rank | Female Poverty |
| Immigrants | Trinidad and Tobago | 0.3 /100 | #251 | Tragic 15.4% |
| Immigrants | Burma/Myanmar | 0.3 /100 | #252 | Tragic 15.4% |
| Liberians | 0.2 /100 | #253 | Tragic 15.4% |
| Trinidadians and Tobagonians | 0.2 /100 | #254 | Tragic 15.4% |
| Ottawa | 0.2 /100 | #255 | Tragic 15.5% |
| Jamaicans | 0.2 /100 | #256 | Tragic 15.5% |
| Immigrants | Jamaica | 0.1 /100 | #257 | Tragic 15.6% |
| Shoshone | 0.1 /100 | #258 | Tragic 15.6% |
| Cape Verdeans | 0.1 /100 | #259 | Tragic 15.6% |
| Immigrants | Guyana | 0.1 /100 | #260 | Tragic 15.6% |
| Guyanese | 0.1 /100 | #261 | Tragic 15.6% |
| Mexican American Indians | 0.1 /100 | #262 | Tragic 15.6% |
| Cherokee | 0.1 /100 | #263 | Tragic 15.6% |
| Immigrants | Ecuador | 0.1 /100 | #264 | Tragic 15.6% |
| Immigrants | Liberia | 0.1 /100 | #265 | Tragic 15.7% |