Immigrants from Jordan vs Immigrants from Hong Kong Male Poverty
COMPARE
Immigrants from Jordan
Immigrants from Hong Kong
Male Poverty
Male Poverty Comparison
Immigrants from Jordan
Immigrants from Hong Kong
10.8%
MALE POVERTY
77.5/ 100
METRIC RATING
139th/ 347
METRIC RANK
9.6%
MALE POVERTY
99.7/ 100
METRIC RATING
19th/ 347
METRIC RANK
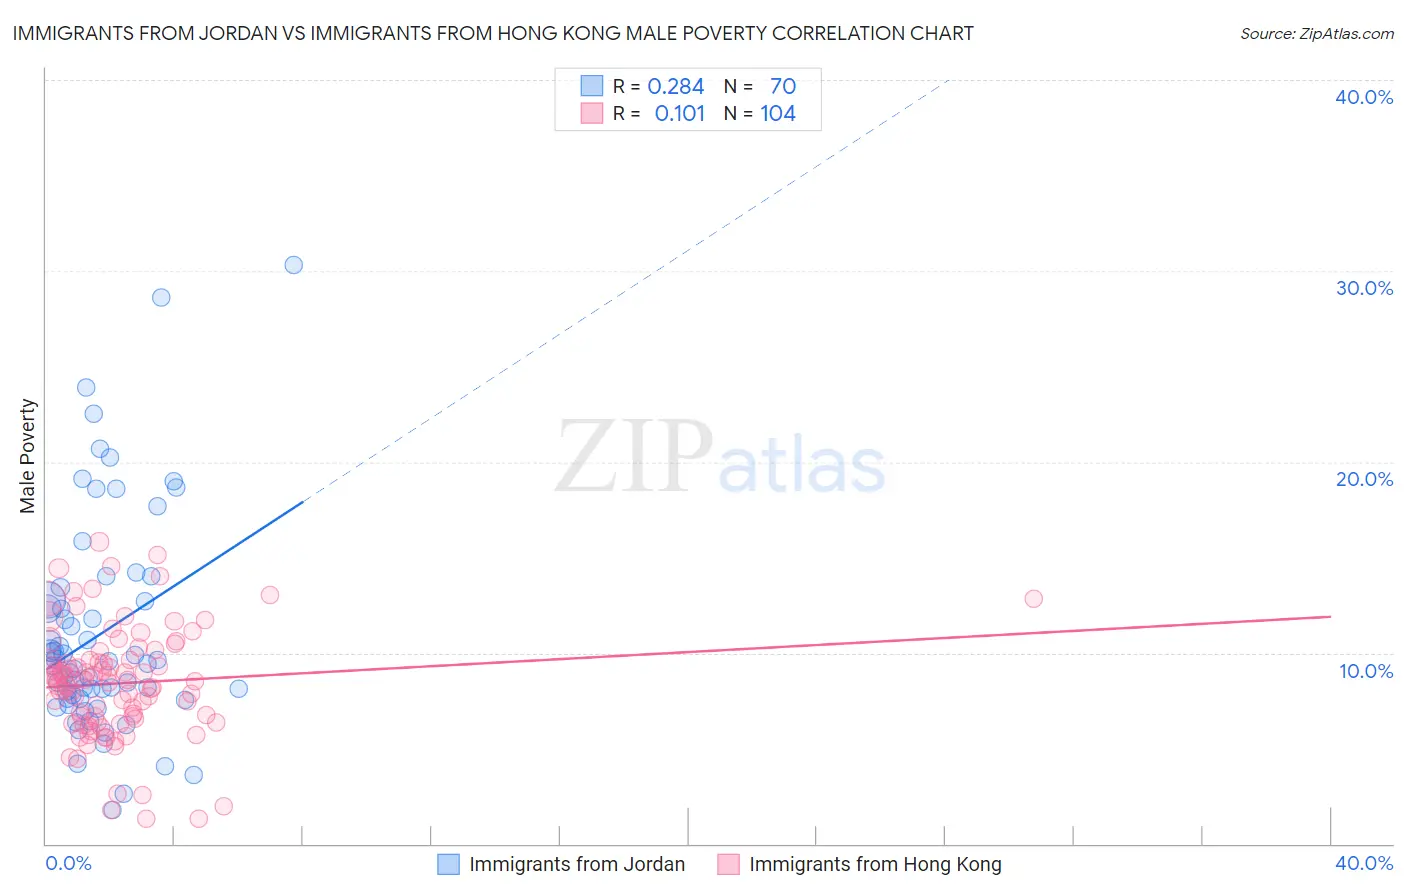
Immigrants from Jordan vs Immigrants from Hong Kong Male Poverty Correlation Chart
The statistical analysis conducted on geographies consisting of 181,249,904 people shows a weak positive correlation between the proportion of Immigrants from Jordan and poverty level among males in the United States with a correlation coefficient (R) of 0.284 and weighted average of 10.8%. Similarly, the statistical analysis conducted on geographies consisting of 253,850,467 people shows a poor positive correlation between the proportion of Immigrants from Hong Kong and poverty level among males in the United States with a correlation coefficient (R) of 0.101 and weighted average of 9.6%, a difference of 13.5%.
Male Poverty Correlation Summary
| Measurement | Immigrants from Jordan | Immigrants from Hong Kong |
| Minimum | 1.8% | 1.3% |
| Maximum | 30.3% | 15.8% |
| Range | 28.5% | 14.5% |
| Mean | 11.0% | 8.4% |
| Median | 9.5% | 8.6% |
| Interquartile 25% (IQ1) | 7.6% | 6.6% |
| Interquartile 75% (IQ3) | 12.7% | 9.6% |
| Interquartile Range (IQR) | 5.2% | 3.0% |
| Standard Deviation (Sample) | 5.7% | 2.9% |
| Standard Deviation (Population) | 5.7% | 2.9% |
Similar Demographics by Male Poverty
Demographics Similar to Immigrants from Jordan by Male Poverty
In terms of male poverty, the demographic groups most similar to Immigrants from Jordan are Yugoslavian (10.8%, a difference of 0.12%), Tlingit-Haida (10.9%, a difference of 0.19%), Immigrants from France (10.9%, a difference of 0.23%), Immigrants from Switzerland (10.8%, a difference of 0.27%), and Basque (10.9%, a difference of 0.40%).
| Demographics | Rating | Rank | Male Poverty |
| Immigrants | Vietnam | 83.0 /100 | #132 | Excellent 10.8% |
| Pakistanis | 83.0 /100 | #133 | Excellent 10.8% |
| New Zealanders | 82.9 /100 | #134 | Excellent 10.8% |
| Brazilians | 82.7 /100 | #135 | Excellent 10.8% |
| Immigrants | Israel | 80.9 /100 | #136 | Excellent 10.8% |
| Immigrants | Switzerland | 79.2 /100 | #137 | Good 10.8% |
| Yugoslavians | 78.2 /100 | #138 | Good 10.8% |
| Immigrants | Jordan | 77.5 /100 | #139 | Good 10.8% |
| Tlingit-Haida | 76.1 /100 | #140 | Good 10.9% |
| Immigrants | France | 75.8 /100 | #141 | Good 10.9% |
| Basques | 74.6 /100 | #142 | Good 10.9% |
| Afghans | 71.9 /100 | #143 | Good 10.9% |
| Samoans | 71.8 /100 | #144 | Good 10.9% |
| Immigrants | Germany | 71.6 /100 | #145 | Good 10.9% |
| Syrians | 71.4 /100 | #146 | Good 10.9% |
Demographics Similar to Immigrants from Hong Kong by Male Poverty
In terms of male poverty, the demographic groups most similar to Immigrants from Hong Kong are Latvian (9.6%, a difference of 0.10%), Lithuanian (9.5%, a difference of 0.18%), Norwegian (9.5%, a difference of 0.35%), Immigrants from Scotland (9.6%, a difference of 0.36%), and Luxembourger (9.5%, a difference of 0.48%).
| Demographics | Rating | Rank | Male Poverty |
| Immigrants | Bolivia | 99.9 /100 | #12 | Exceptional 9.4% |
| Immigrants | Lithuania | 99.9 /100 | #13 | Exceptional 9.4% |
| Immigrants | North Macedonia | 99.8 /100 | #14 | Exceptional 9.4% |
| Bhutanese | 99.8 /100 | #15 | Exceptional 9.5% |
| Luxembourgers | 99.8 /100 | #16 | Exceptional 9.5% |
| Norwegians | 99.8 /100 | #17 | Exceptional 9.5% |
| Lithuanians | 99.8 /100 | #18 | Exceptional 9.5% |
| Immigrants | Hong Kong | 99.7 /100 | #19 | Exceptional 9.6% |
| Latvians | 99.7 /100 | #20 | Exceptional 9.6% |
| Immigrants | Scotland | 99.7 /100 | #21 | Exceptional 9.6% |
| Croatians | 99.7 /100 | #22 | Exceptional 9.6% |
| Italians | 99.7 /100 | #23 | Exceptional 9.6% |
| Swedes | 99.7 /100 | #24 | Exceptional 9.6% |
| Eastern Europeans | 99.6 /100 | #25 | Exceptional 9.6% |
| Burmese | 99.6 /100 | #26 | Exceptional 9.7% |